Question 1: For each of the following, explain what is wrong and why. (a) A z statistic is used to test the null hypothesis that P1 = P2. (b) If two sample proportions are equal, then the sample counts are equal. (c) When testing Ho: P1 = p2, we must expect at least 10 successes and failures in our random samples. (d) Does a higher proportion of second year students study 10 hours weekly than first year students? To find out, I randomly choose a statistics course and then look at the proportion of first year students in that class and of second year students in that class that study 10 hours per week. Question 2: To estimate p – P2, a 95% confidence interval is computed as (-0.13,0.32). Assuming all as- sumptions are met, what can be gleaned from this? (a) An error was made since proportions can't be negative. (b) It would appear that p1 # p2 since the differences can be non-zero. (c) We can't statistically say that p1 # p2 since our confidence interval includes 0. (d) We would conclude HA : P1 # P2 at the a = 0.05 significance level.
Question 1: For each of the following, explain what is wrong and why. (a) A z statistic is used to test the null hypothesis that P1 = P2. (b) If two sample proportions are equal, then the sample counts are equal. (c) When testing Ho: P1 = p2, we must expect at least 10 successes and failures in our random samples. (d) Does a higher proportion of second year students study 10 hours weekly than first year students? To find out, I randomly choose a statistics course and then look at the proportion of first year students in that class and of second year students in that class that study 10 hours per week. Question 2: To estimate p – P2, a 95% confidence interval is computed as (-0.13,0.32). Assuming all as- sumptions are met, what can be gleaned from this? (a) An error was made since proportions can't be negative. (b) It would appear that p1 # p2 since the differences can be non-zero. (c) We can't statistically say that p1 # p2 since our confidence interval includes 0. (d) We would conclude HA : P1 # P2 at the a = 0.05 significance level.

MATLAB: An Introduction with Applications
6th Edition
ISBN:9781119256830
Author:Amos Gilat
Publisher:Amos Gilat
Chapter1: Starting With Matlab
Section: Chapter Questions
Problem 1P

Related questions
Topic Video
Question
Question 1 and 2
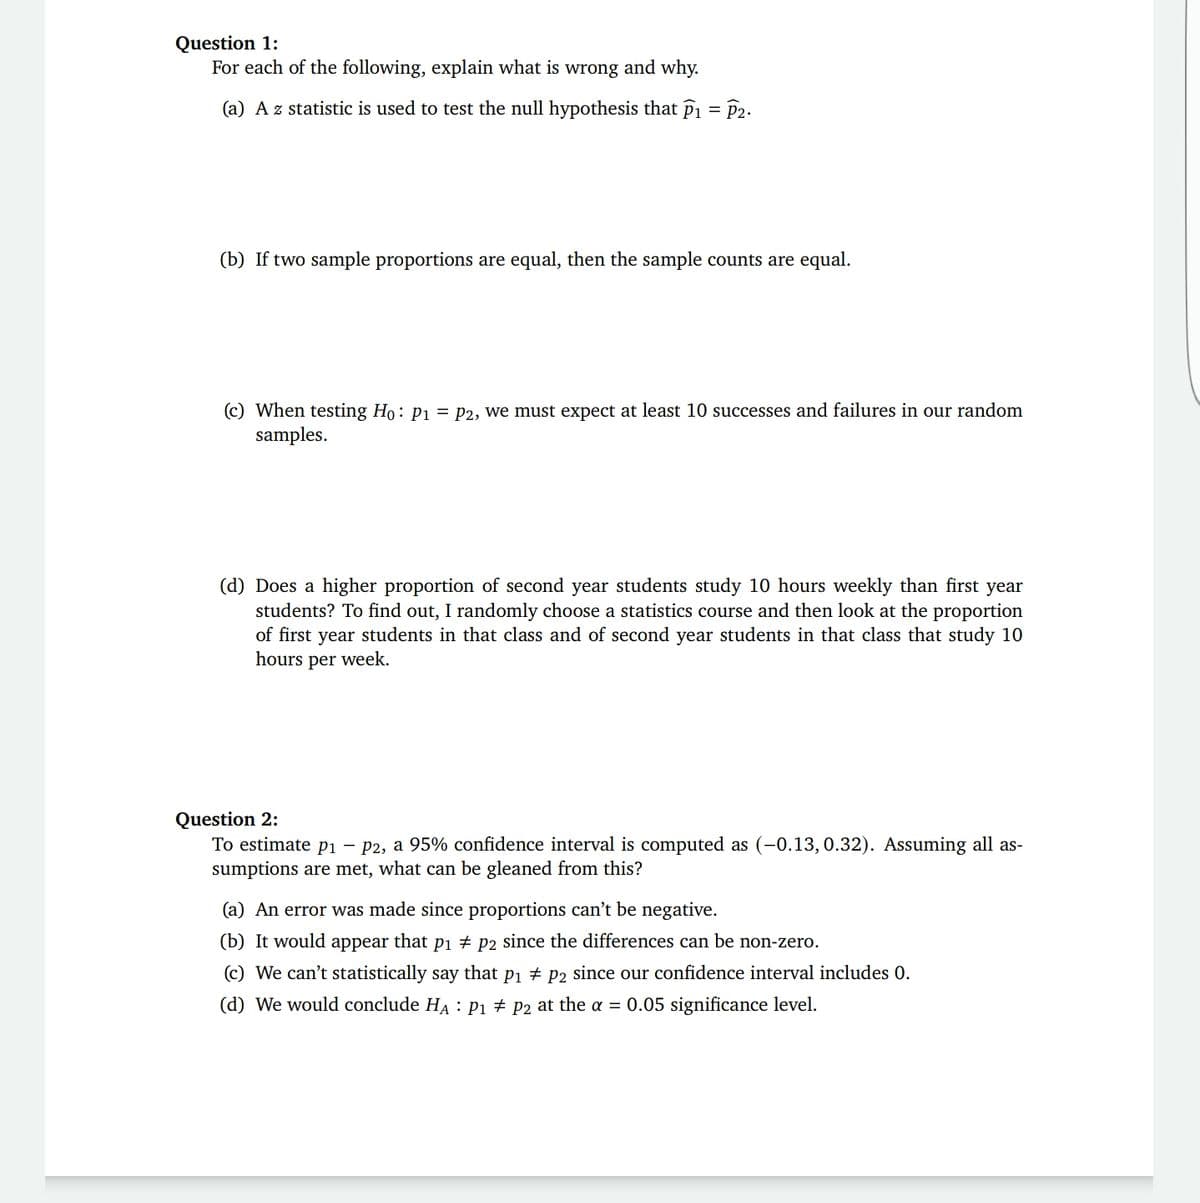
Transcribed Image Text:Question 1:
For each of the following, explain what is wrong and why.
(a) A z statistic is used to test the null hypothesis that P1 = P2.
(b) If two sample proportions are equal, then the sample counts are equal.
(c) When testing Ho: P1 = P2, we must expect at least 10 successes and failures in our random
samples.
(d) Does a higher proportion of second year students study 10 hours weekly than first year
students? To find out, I randomly choose a statistics course and then look at the proportion
of first year students in that class and of second year students in that class that study 10
hours per week.
Question 2:
To estimate p1 – P2, a 95% confidence interval is computed as (-0.13, 0.32). Assuming all as-
sumptions are met, what can be gleaned from this?
(a) An error was made since proportions can't be negative.
(b) It would appear that pi + p2 since the differences can be non-zero.
(c) We can't statistically say that pi # P2 since our confidence interval includes 0.
(d) We would conclude HA : Pi # P2 at the = 0.05 significance level.
Expert Solution
This question has been solved!
Explore an expertly crafted, step-by-step solution for a thorough understanding of key concepts.

This is a popular solution!

Trending now
This is a popular solution!

Step by step
Solved in 3 steps

Knowledge Booster


Learn more about
Need a deep-dive on the concept behind this application? Look no further. Learn more about this topic, statistics and related others by exploring similar questions and additional content below.Recommended textbooks for you
MATLAB: An Introduction with Applications
Statistics
ISBN:
9781119256830
Author:
Amos Gilat
Publisher:
John Wiley & Sons Inc

Probability and Statistics for Engineering and th…
Statistics
ISBN:
9781305251809
Author:
Jay L. Devore
Publisher:
Cengage Learning

Statistics for The Behavioral Sciences (MindTap C…
Statistics
ISBN:
9781305504912
Author:
Frederick J Gravetter, Larry B. Wallnau
Publisher:
Cengage Learning
MATLAB: An Introduction with Applications
Statistics
ISBN:
9781119256830
Author:
Amos Gilat
Publisher:
John Wiley & Sons Inc
Probability and Statistics for Engineering and th…
Statistics
ISBN:
9781305251809
Author:
Jay L. Devore
Publisher:
Cengage Learning
Statistics for The Behavioral Sciences (MindTap C…
Statistics
ISBN:
9781305504912
Author:
Frederick J Gravetter, Larry B. Wallnau
Publisher:
Cengage Learning

Elementary Statistics: Picturing the World (7th E…
Statistics
ISBN:
9780134683416
Author:
Ron Larson, Betsy Farber
Publisher:
PEARSON

The Basic Practice of Statistics
Statistics
ISBN:
9781319042578
Author:
David S. Moore, William I. Notz, Michael A. Fligner
Publisher:
W. H. Freeman

Introduction to the Practice of Statistics
Statistics
ISBN:
9781319013387
Author:
David S. Moore, George P. McCabe, Bruce A. Craig
Publisher:
W. H. Freeman