QUESTION 2 Many elementary school students in a school district currently have ear infections. A random sample of children in two different schools found that 16 of 40 at one school and 13 of 30 at the other had this infection. Conduct a test to answer if there is sufficient evidence to conclude that a difference exists between the proportion of students who have ear infections at one school and the other. Find the p-value. 0.32 QUESTION 3 Fill in the blanks using the following choices: reject, fail to reject, sufficient, enough, not sufficient, not enough If the p value is 0.32 to test if there is a difference exists between the proportion of students who have ear infections at one school and the other, your decision is to the null and the conclusion: There is evidence to support the alternative that the proportion of students who have ear infections at one school and the other are different.
QUESTION 2 Many elementary school students in a school district currently have ear infections. A random sample of children in two different schools found that 16 of 40 at one school and 13 of 30 at the other had this infection. Conduct a test to answer if there is sufficient evidence to conclude that a difference exists between the proportion of students who have ear infections at one school and the other. Find the p-value. 0.32 QUESTION 3 Fill in the blanks using the following choices: reject, fail to reject, sufficient, enough, not sufficient, not enough If the p value is 0.32 to test if there is a difference exists between the proportion of students who have ear infections at one school and the other, your decision is to the null and the conclusion: There is evidence to support the alternative that the proportion of students who have ear infections at one school and the other are different.

Holt Mcdougal Larson Pre-algebra: Student Edition 2012
1st Edition
ISBN:9780547587776
Author:HOLT MCDOUGAL
Publisher:HOLT MCDOUGAL
Chapter11: Data Analysis And Probability
Section: Chapter Questions
Problem 8CR

Related questions

Concept explainers
Contingency Table
A contingency table can be defined as the visual representation of the relationship between two or more categorical variables that can be evaluated and registered. It is a categorical version of the scatterplot, which is used to investigate the linear relationship between two variables. A contingency table is indeed a type of frequency distribution table that displays two variables at the same time.
Binomial Distribution
Binomial is an algebraic expression of the sum or the difference of two terms. Before knowing about binomial distribution, we must know about the binomial theorem.
Topic Video
Question
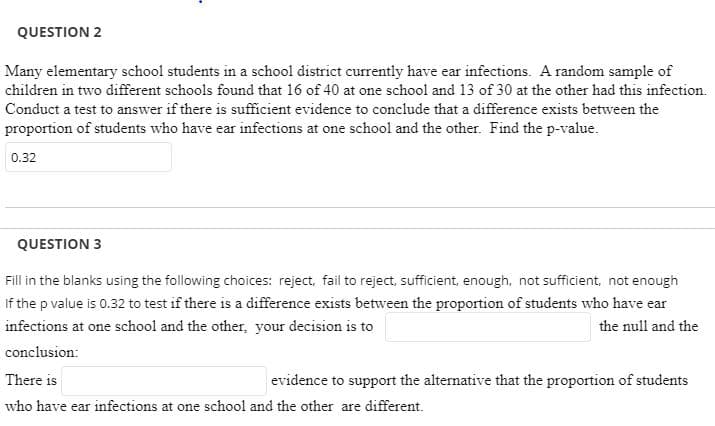
Transcribed Image Text:QUESTION 2
Many elementary school students in a school district currently have ear infections. A random sample of
children in two different schools found that 16 of 40 at one school and 13 of 30 at the other had this infection.
Conduct a test to answer if there is sufficient evidence to conclude that a difference exists between the
proportion of students who have ear infections at one school and the other. Find the p-value.
0.32
QUESTION 3
Fill in the blanks using the following choices: reject, fail to reject, sufficient, enough, not sufficient, not enough
If the p value is 0.32 to test if there is a difference exists between the proportion of students who have ear
infections at one school and the other, your decision is to
the null and the
conclusion:
There is
evidence to support the alternative that the proportion of students
who have ear infections at one school and the other are different.
Expert Solution
This question has been solved!
Explore an expertly crafted, step-by-step solution for a thorough understanding of key concepts.

This is a popular solution!

Trending now
This is a popular solution!

Step by step
Solved in 3 steps

Knowledge Booster


Learn more about
Need a deep-dive on the concept behind this application? Look no further. Learn more about this topic, statistics and related others by exploring similar questions and additional content below.Recommended textbooks for you
Holt Mcdougal Larson Pre-algebra: Student Edition…
Algebra
ISBN:
9780547587776
Author:
HOLT MCDOUGAL
Publisher:
HOLT MCDOUGAL

College Algebra
Algebra
ISBN:
9781305115545
Author:
James Stewart, Lothar Redlin, Saleem Watson
Publisher:
Cengage Learning

Algebra & Trigonometry with Analytic Geometry
Algebra
ISBN:
9781133382119
Author:
Swokowski
Publisher:
Cengage
Holt Mcdougal Larson Pre-algebra: Student Edition…
Algebra
ISBN:
9780547587776
Author:
HOLT MCDOUGAL
Publisher:
HOLT MCDOUGAL
College Algebra
Algebra
ISBN:
9781305115545
Author:
James Stewart, Lothar Redlin, Saleem Watson
Publisher:
Cengage Learning
Algebra & Trigonometry with Analytic Geometry
Algebra
ISBN:
9781133382119
Author:
Swokowski
Publisher:
Cengage

College Algebra (MindTap Course List)
Algebra
ISBN:
9781305652231
Author:
R. David Gustafson, Jeff Hughes
Publisher:
Cengage Learning