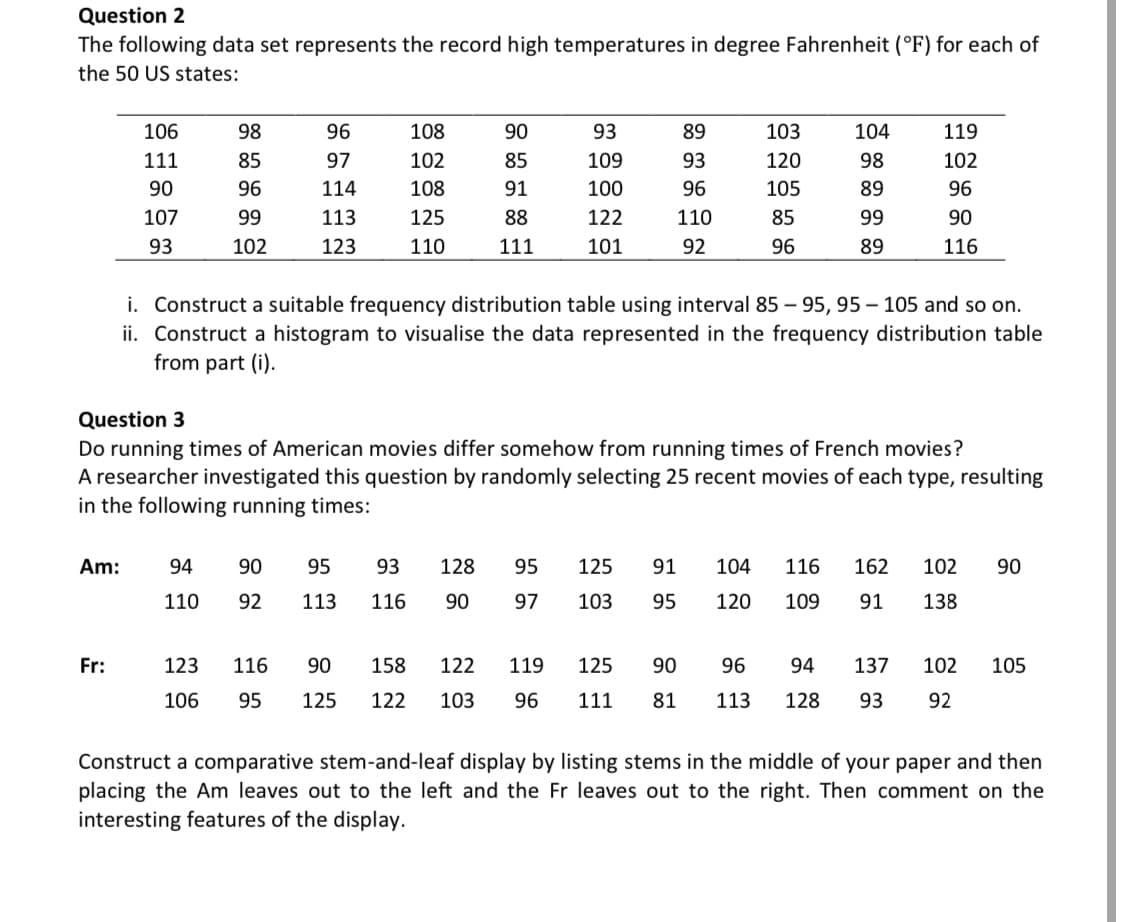
Question 2 The following data set represents the record high temperatures in degree Fahrenheit (°F) for each of the 50 US states: 106 98 96 108 90 93 89 103 104 119 111 85 97 102 85 109 93 120 98 102 90 96 114 108 91 100 96 105 89 96 107 99 113 125 88 122 110 85 99 90 93 102 123 110 111 101 92 96 89 116 i. Construct a suitable frequency distribution table using interval 85 – 95, 95 – 105 and so on. ii. Construct a histogram to visualise the data represented in the frequency distribution table from part (i).
Question 2 The following data set represents the record high temperatures in degree Fahrenheit (°F) for each of the 50 US states: 106 98 96 108 90 93 89 103 104 119 111 85 97 102 85 109 93 120 98 102 90 96 114 108 91 100 96 105 89 96 107 99 113 125 88 122 110 85 99 90 93 102 123 110 111 101 92 96 89 116 i. Construct a suitable frequency distribution table using interval 85 – 95, 95 – 105 and so on. ii. Construct a histogram to visualise the data represented in the frequency distribution table from part (i).

Glencoe Algebra 1, Student Edition, 9780079039897, 0079039898, 2018
18th Edition
ISBN:9780079039897
Author:Carter
Publisher:Carter
Chapter10: Statistics
Section10.6: Summarizing Categorical Data
Problem 4DGP

Related questions
Question
Transcribed Image Text:Question 2
The following data set represents the record high temperatures in degree Fahrenheit (°F) for each of
the 50 US states:
106
98
96
108
90
93
89
103
104
119
111
85
97
102
85
109
93
120
98
102
90
96
114
108
91
100
96
105
89
96
107
99
113
125
88
122
110
85
99
90
93
102
123
110
111
101
92
96
89
116
i. Construct a suitable frequency distribution table using interval 85 – 95, 95 – 105 and so on.
ii. Construct a histogram to visualise the data represented in the frequency distribution table
from part (i).
Question 3
Do running times of American movies differ somehow from running times of French movies?
A researcher investigated this question by randomly selecting 25 recent movies of each type, resulting
in the following running times:
Am:
94
90
95
93
128
95
125
91
104
116
162
102
90
110
92
113
116
90
97
103
95
120
109
91
138
Fr:
123
116
90
158
122
119
125
90
96
94
137
102
105
106
95
125
122
103
96
111
81
113
128
93
92
Construct a comparative stem-and-leaf display by listing stems in the middle of your paper and then
placing the Am leaves out to the left and the Fr leaves out to the right. Then comment on the
interesting features of the display.
Expert Solution
This question has been solved!
Explore an expertly crafted, step-by-step solution for a thorough understanding of key concepts.

This is a popular solution!

Trending now
This is a popular solution!

Step by step
Solved in 2 steps with 2 images

Knowledge Booster


Learn more about
Need a deep-dive on the concept behind this application? Look no further. Learn more about this topic, statistics and related others by exploring similar questions and additional content below.Recommended textbooks for you
Glencoe Algebra 1, Student Edition, 9780079039897…
Algebra
ISBN:
9780079039897
Author:
Carter
Publisher:
McGraw Hill
Glencoe Algebra 1, Student Edition, 9780079039897…
Algebra
ISBN:
9780079039897
Author:
Carter
Publisher:
McGraw Hill