SITUATION 1 The following scores represent the final examination grades for an elementary statistics course (treated as population): 23 60 79 32 17 64 52 70 82 36 80 77 81 95 41 65 92 85 55 76 52 10 64 75 78 80 98 81 67 (a) Construct a frequency distribution table for the given data set. Use a class size of 10 and start from 10 (i.e. 10-19, 20-29 etc.). pts) Complete the table Class Midpoint, Cum. Frequency FX Frequency (x-X)2 Interval, x 14.5 24.5 34.5 44.5 54.5 64.5 25
SITUATION 1 The following scores represent the final examination grades for an elementary statistics course (treated as population): 23 60 79 32 17 64 52 70 82 36 80 77 81 95 41 65 92 85 55 76 52 10 64 75 78 80 98 81 67 (a) Construct a frequency distribution table for the given data set. Use a class size of 10 and start from 10 (i.e. 10-19, 20-29 etc.). pts) Complete the table Class Midpoint, Cum. Frequency FX Frequency (x-X)2 Interval, x 14.5 24.5 34.5 44.5 54.5 64.5 25

Glencoe Algebra 1, Student Edition, 9780079039897, 0079039898, 2018
18th Edition
ISBN:9780079039897
Author:Carter
Publisher:Carter
Chapter10: Statistics
Section10.6: Summarizing Categorical Data
Problem 4DGP

Related questions
Question
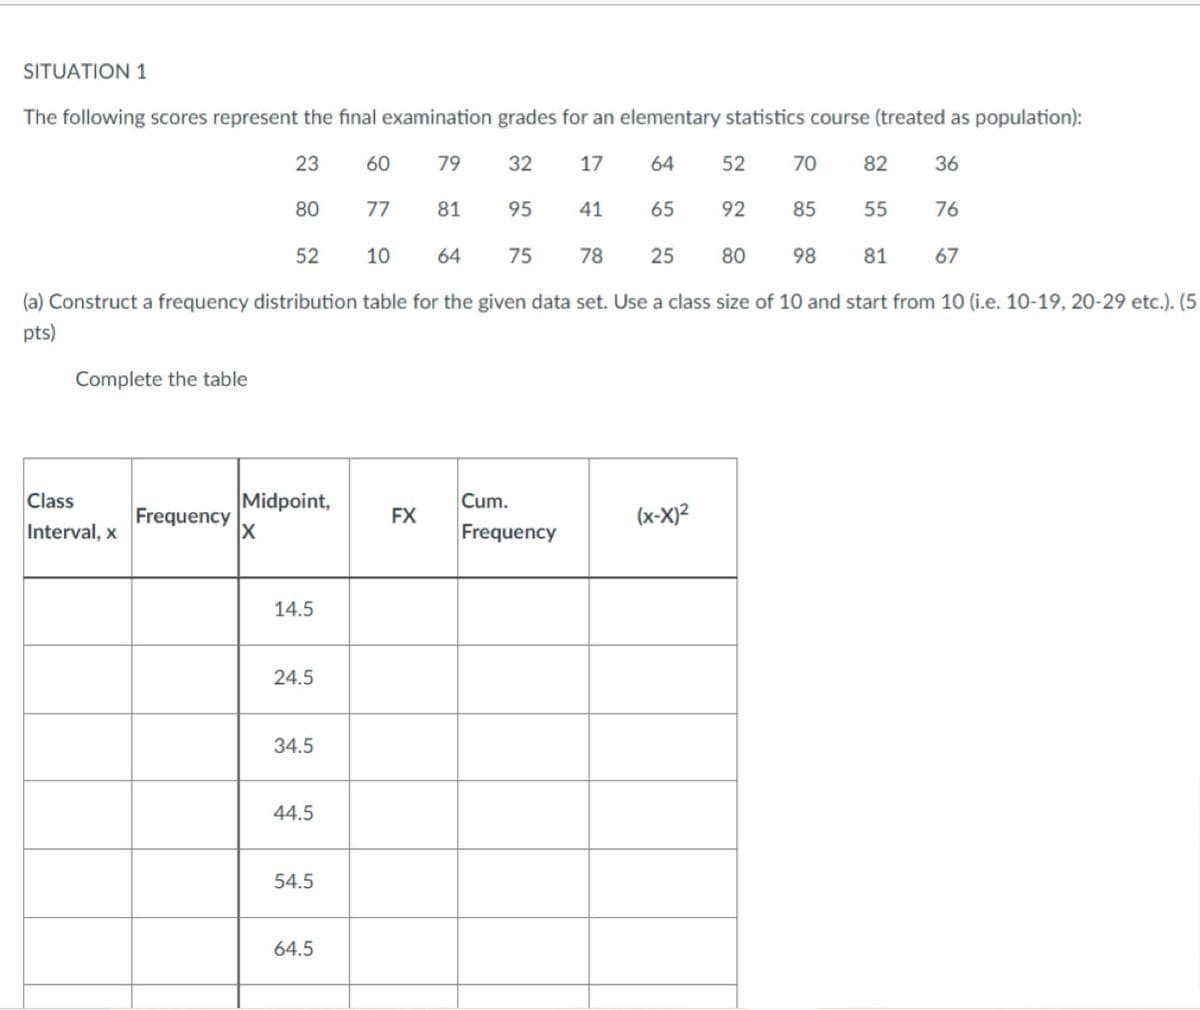
Transcribed Image Text:SITUATION 1
The following scores represent the final examination grades for an elementary statistics course (treated as population):
60
79
32
17
64
52
70
82
36
80
77
81
95
41
65
92
85
55
76
52
10
64
75
78
25
80
98
81
67
(a) Construct a frequency distribution table for the given data set. Use a class size of 10 and start from 10 (i.e. 10-19, 20-29 etc.). (5
pts)
Complete the table
Class
Midpoint,
Cum.
Frequency
FX
(x-X)2
Interval, x
Frequency
14.5
24.5
34.5
44.5
54.5
64.5
23

Transcribed Image Text:44.5
54.5
64.5
74.5
84.5
94.5
Expert Solution
This question has been solved!
Explore an expertly crafted, step-by-step solution for a thorough understanding of key concepts.

Step by step
Solved in 2 steps with 1 images

Recommended textbooks for you
Glencoe Algebra 1, Student Edition, 9780079039897…
Algebra
ISBN:
9780079039897
Author:
Carter
Publisher:
McGraw Hill
Glencoe Algebra 1, Student Edition, 9780079039897…
Algebra
ISBN:
9780079039897
Author:
Carter
Publisher:
McGraw Hill