QUESTION 29 The first step in multiple regression analysis is to O procure a powerful computer. O identify the important variables. O specify a functional form to be estimated. gather all available data. select an estimation procedure. OOO
QUESTION 29 The first step in multiple regression analysis is to O procure a powerful computer. O identify the important variables. O specify a functional form to be estimated. gather all available data. select an estimation procedure. OOO

Essentials of Economics (MindTap Course List)
8th Edition
ISBN:9781337091992
Author:N. Gregory Mankiw
Publisher:N. Gregory Mankiw
Chapter5: Elastic And Its Application
Section: Chapter Questions
Problem 10PA

Related questions
Question
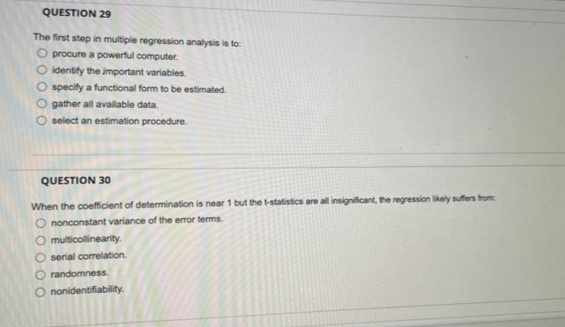
Transcribed Image Text:QUESTION 29
The first step in multiple regression analysis is to:
O procure a powerful computer.
O identify the important variables.
O specify a functional form to be estimated.
O gather all available data.
select an estimation procedure.
QUESTION 30
When the coefficient of determination is near 1 but the t-statistics are all insignificant, the regression ikely sufers from
O nonconstant variance of the error terms.
O multicollinearity.
O serial correlation.
O randomness.
O nonidentifiability.
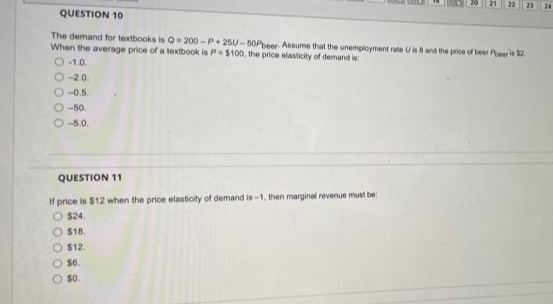
Transcribed Image Text:QUESTION 10
The demand for textbooks is Q-200-P+ 25U- 50Peer Assume that the unemployment rate Uand the price of beer Peer2.
When the average price of a textbook is P$100, the price elasticity of demand is
O -1.0.
O-2.0.
O -0.5.
O -50.
O5.0.
QUESTION 11
If price is $12 when the price elasticity of demand is-1, then marginal revenue must be:
O $24.
O $18.
O $12.
O $6.
O s0.
Expert Solution
This question has been solved!
Explore an expertly crafted, step-by-step solution for a thorough understanding of key concepts.

This is a popular solution!

Trending now
This is a popular solution!

Step by step
Solved in 2 steps

Recommended textbooks for you
Essentials of Economics (MindTap Course List)
Economics
ISBN:
9781337091992
Author:
N. Gregory Mankiw
Publisher:
Cengage Learning

Principles of Economics 2e
Economics
ISBN:
9781947172364
Author:
Steven A. Greenlaw; David Shapiro
Publisher:
OpenStax
Essentials of Economics (MindTap Course List)
Economics
ISBN:
9781337091992
Author:
N. Gregory Mankiw
Publisher:
Cengage Learning
Principles of Economics 2e
Economics
ISBN:
9781947172364
Author:
Steven A. Greenlaw; David Shapiro
Publisher:
OpenStax