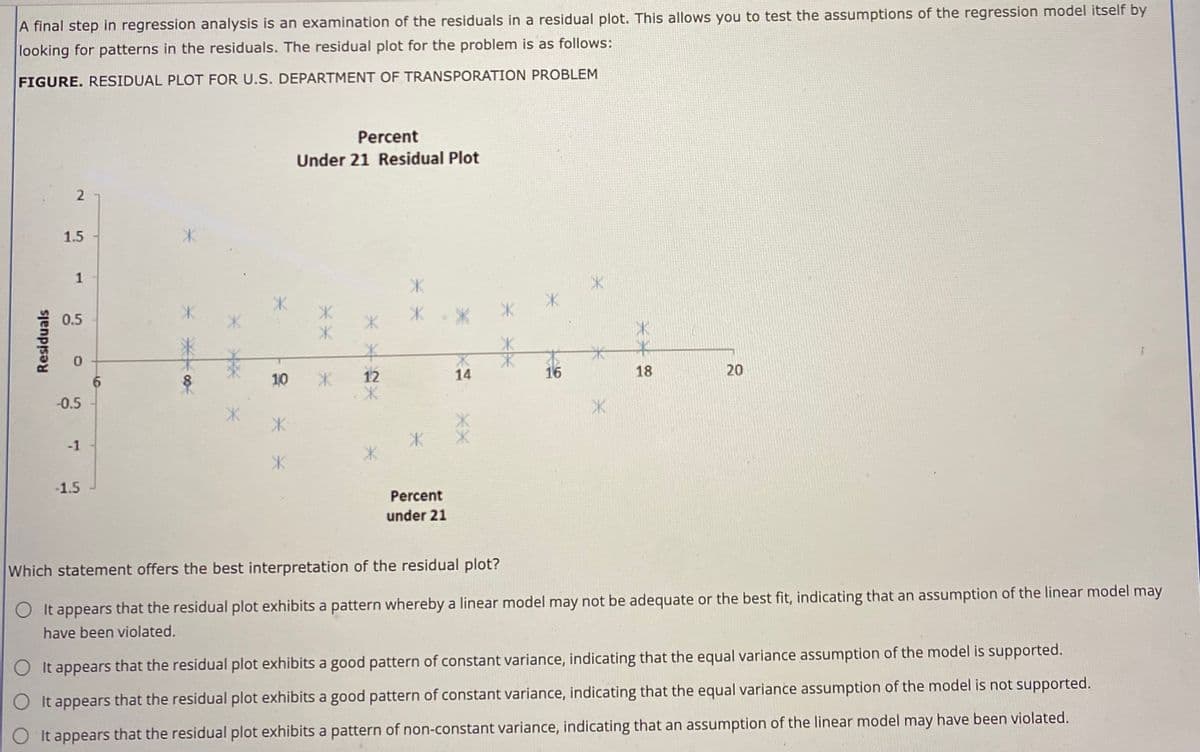
A final step in regression analysis is an examination of the residuals in a residual plot. This allows you to test the assumptions of the regression model itself by looking for patterns in the residuals. The residual plot for the problem is as follows: FIGURE. RESIDUAL PLOT FOR U.S. DEPARTMENT OF TRANSPORATION PROBLEM Percent Under 21 Residual Plot 2 1.5 1 0.5 半 to 16 10 12 14 18 20 -0.5 -1 -1.5 Percent under 21 Which statement offers the best interpretation of the residual plot? O It appears that the residual plot exhibits a pattern whereby a linear model may not be adequate or the best fit, indicating that an assumption of the linear model may have been violated. O It appears that the residual plot exhibits a good pattern of constant variance, indicating that the equal variance assumption of the model is supported. aEcumption of the model is not supported. Residuals -00
A final step in regression analysis is an examination of the residuals in a residual plot. This allows you to test the assumptions of the regression model itself by looking for patterns in the residuals. The residual plot for the problem is as follows: FIGURE. RESIDUAL PLOT FOR U.S. DEPARTMENT OF TRANSPORATION PROBLEM Percent Under 21 Residual Plot 2 1.5 1 0.5 半 to 16 10 12 14 18 20 -0.5 -1 -1.5 Percent under 21 Which statement offers the best interpretation of the residual plot? O It appears that the residual plot exhibits a pattern whereby a linear model may not be adequate or the best fit, indicating that an assumption of the linear model may have been violated. O It appears that the residual plot exhibits a good pattern of constant variance, indicating that the equal variance assumption of the model is supported. aEcumption of the model is not supported. Residuals -00

Chapter1: Making Economics Decisions
Section: Chapter Questions
Problem 1QTC

Related questions
Question
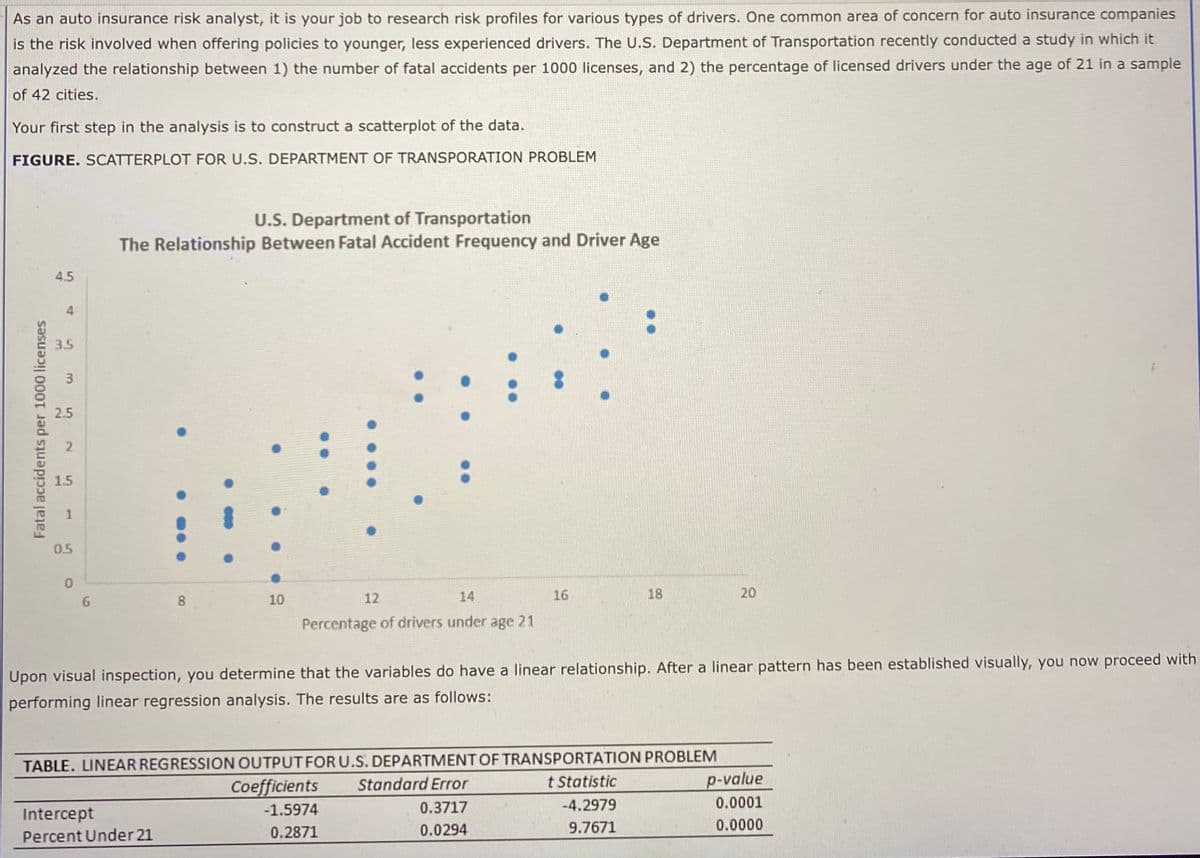
Transcribed Image Text:As an auto insurance risk analyst, it is your job to research risk profiles for various types of drivers. One common area of concern for auto insurance companies
is the risk involved when offering policies to younger, less experienced drivers. The U.S. Department of Transportation recently conducted a study in which it
analyzed the relationship between 1) the number of fatal accidents per 1000 licenses, and 2) the percentage of licensed drivers under the age of 21 in a sample
of 42 cities.
Your first step in the analysis is to construct a scatterplot of the data.
FIGURE. SCATTERPLOT FOR U.S. DEPARTMENT OF TRANSPORATION PROBLEM
U.S. Department of Transportation
The Relationship Between Fatal Accident Frequency and Driver Age
4.5
3.5
3
2.5
2.
1.5
0.5
8.
10
12
14
16
18
20
Percentage of drivers under age 21
Upon visual inspection, you determine that the variables do have a linear relationship. After a linear pattern has been established visually, you now proceed with
performing linear regression analysis. The results are as follows:
TABLE. LINEAR REGRESSION OUTPUTFORU.S. DEPARTMENT OF TRANSPORTATION PROBLEM
Standard Error
t Statistic
p-value
Coefficients
-1.5974
0.3717
-4.2979
0.0001
Intercept
0.2871
0.0294
9.7671
0.0000
Percent Under 21
Fatal accidents per 1000 licenses
1.
Transcribed Image Text:A final step in regression analysis is an examination of the residuals in a residual plot. This allows you to test the assumptions of the regression model itself by
looking for patterns in the residuals. The residual plot for the problem is as follows:
FIGURE. RESIDUAL PLOT FOR U.S. DEPARTMENT OF TRANSPORATION PROBLEM
Percent
Under 21 Residual Plot
2
1.5
0.5
半
10
12
14
16
18
20
6.
-0.5
-1
-1.5
Percent
under 21
Which statement offers the best interpretation of the residual plot?
O It appears that the residual plot exhibits a pattern whereby a linear model may not be adequate or the best fit, indicating that an assumption of the linear model may
have been violated.
O It appears that the residual plot exhibits a good pattern of constant variance, indicating that the equal variance assumption of the model is supported.
It appears that the residual plot exhibits a good pattern of constant variance, indicating that the equal variance assumption of the model is not supported.
O It appears that the residual plot exhibits a pattern of non-constant variance, indicating that an assumption of the linear model may have been violated.
米米
* *
1.
Residuals
Expert Solution
This question has been solved!
Explore an expertly crafted, step-by-step solution for a thorough understanding of key concepts.

This is a popular solution!

Trending now
This is a popular solution!

Step by step
Solved in 2 steps

Knowledge Booster


Learn more about
Need a deep-dive on the concept behind this application? Look no further. Learn more about this topic, economics and related others by exploring similar questions and additional content below.Recommended textbooks for you

Principles of Economics (12th Edition)
Economics
ISBN:
9780134078779
Author:
Karl E. Case, Ray C. Fair, Sharon E. Oster
Publisher:
PEARSON

Engineering Economy (17th Edition)
Economics
ISBN:
9780134870069
Author:
William G. Sullivan, Elin M. Wicks, C. Patrick Koelling
Publisher:
PEARSON
Principles of Economics (12th Edition)
Economics
ISBN:
9780134078779
Author:
Karl E. Case, Ray C. Fair, Sharon E. Oster
Publisher:
PEARSON
Engineering Economy (17th Edition)
Economics
ISBN:
9780134870069
Author:
William G. Sullivan, Elin M. Wicks, C. Patrick Koelling
Publisher:
PEARSON

Principles of Economics (MindTap Course List)
Economics
ISBN:
9781305585126
Author:
N. Gregory Mankiw
Publisher:
Cengage Learning

Managerial Economics: A Problem Solving Approach
Economics
ISBN:
9781337106665
Author:
Luke M. Froeb, Brian T. McCann, Michael R. Ward, Mike Shor
Publisher:
Cengage Learning

Managerial Economics & Business Strategy (Mcgraw-…
Economics
ISBN:
9781259290619
Author:
Michael Baye, Jeff Prince
Publisher:
McGraw-Hill Education