Question 3: How many hours a week do you spend on self-improvement? The graphs and charts below represent a survey using two qualitative variables. In the space provided below the last graph of question 3, please state a conclusion for these graphs. This should include answering the following. What are the explanatory and response variables? What is the correlation coefficient? Is there a linear correlation? Also state what the least squares regression line is and explain the meaning of the slope and y-intercept in this situation, State other things that you found interesting from this study. Make a prediction about what you expect to happen in the future based on your results. Regression Model Summary Adjusted R Std. Error of the Model R Square Estimate R Square 606 368 345 97245 a Predictors: (Constant), Socialmedia Scatterplot of Self-improvement vs Social Media Hours Lne0 Coefficients 700 Standardized Unstandardized Coefficients Coefficients .00 Model B Std. Error Beta Sig (Constant) 5.705 398 14.324 .000 Socialmedia -863 214 -606 -4.034 000 500 a. Dependent Variable: SelfimncavemeottiRS 400 Part C Conclusion: 300- Explanatory variable: Social media (explanatory variables are independent and has an affect on the response variable) Response variable: selfimprovementHRS Correlation coefficient: - 0.606 200 100 200 300 400 Socialmedia Linear relationship: Yes, because when social media increases, self-improvement decreases Slope: -0.863 Slope interpretation: 1 unit increase for hours spent on social media will decrease the self-improvement by 0.863 unit Y: 5.705 Correlations Selfaacovement HRS Socialmedia Y-intercept interpretation: on average, if social media is at 0, self-improvement will be at 5.705 SallmacaamanltiRS Pearson Corelation 1 -606 Future prediction: If social media decreases, then self-improvement should increase.
Question 3: How many hours a week do you spend on self-improvement? The graphs and charts below represent a survey using two qualitative variables. In the space provided below the last graph of question 3, please state a conclusion for these graphs. This should include answering the following. What are the explanatory and response variables? What is the correlation coefficient? Is there a linear correlation? Also state what the least squares regression line is and explain the meaning of the slope and y-intercept in this situation, State other things that you found interesting from this study. Make a prediction about what you expect to happen in the future based on your results. Regression Model Summary Adjusted R Std. Error of the Model R Square Estimate R Square 606 368 345 97245 a Predictors: (Constant), Socialmedia Scatterplot of Self-improvement vs Social Media Hours Lne0 Coefficients 700 Standardized Unstandardized Coefficients Coefficients .00 Model B Std. Error Beta Sig (Constant) 5.705 398 14.324 .000 Socialmedia -863 214 -606 -4.034 000 500 a. Dependent Variable: SelfimncavemeottiRS 400 Part C Conclusion: 300- Explanatory variable: Social media (explanatory variables are independent and has an affect on the response variable) Response variable: selfimprovementHRS Correlation coefficient: - 0.606 200 100 200 300 400 Socialmedia Linear relationship: Yes, because when social media increases, self-improvement decreases Slope: -0.863 Slope interpretation: 1 unit increase for hours spent on social media will decrease the self-improvement by 0.863 unit Y: 5.705 Correlations Selfaacovement HRS Socialmedia Y-intercept interpretation: on average, if social media is at 0, self-improvement will be at 5.705 SallmacaamanltiRS Pearson Corelation 1 -606 Future prediction: If social media decreases, then self-improvement should increase.

College Algebra
7th Edition
ISBN:9781305115545
Author:James Stewart, Lothar Redlin, Saleem Watson
Publisher:James Stewart, Lothar Redlin, Saleem Watson
Chapter1: Equations And Graphs
Section: Chapter Questions
Problem 8P: Noise and Intelligibility Audiologists study the intelligibility of spoken sentences under different...

Related questions
Question
100%
I could use some help. I included what I think is correct..
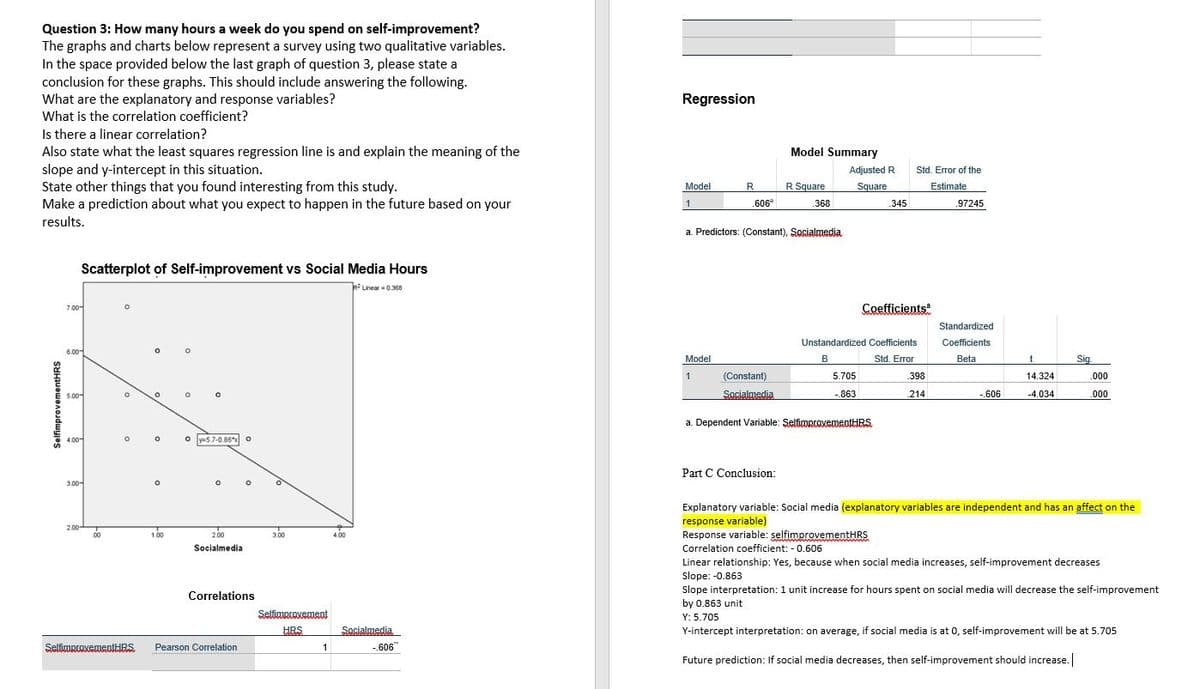
Transcribed Image Text:Question 3: How many hours a week do you spend on self-improvement?
The graphs and charts below represent a survey using two qualitative variables.
In the space provided below the last graph of question 3, please state a
conclusion for these graphs. This should include answering the following.
What are the explanatory and response variables?
Regression
What is the correlation coefficient?
Is there a linear correlation?
Also state what the least squares regression line is and explain the meaning of the
slope and y-intercept in this situation.
State other things that you found interesting from this study.
Make a prediction about what you expect to happen in the future based on your
Model Summary
Adjusted R
Std. Error of the
Model
R
R Square
Square
Estimate
1
.606°
368
.345
.97245
results.
a. Predictors: (Constant), Socialmedia.
Scatterplot of Self-improvement vs Social Media Hours
R Linear -0.360
7.00-
Coefficients
Standardized
Unstandardized Coefficients
Coefficients
6.00
Model
B
Std. Error
Beta
t
Sig.
(Constant)
5.705
.398
14.324
.000
Socialmedia
-.863
500-
.214
-.606
-4.034
.000
a. Dependent Variable: ŞelfimprovementHRS
4 00
o y-5.7-0.86 o
Part C Conclusion:
300-
Explanatory variable: Social media (explanatory variables are independent and has an affect on the
response variable)
Response variable: selfimprovementHRS
200-
00
1.00
2.00
3.00
4.00
Socialmedia
Correlation coefficient: - 0.606
Linear relationship: Yes, because when social media increases, self-improvement decreases
Slope: -0.863
Slope interpretation: 1 unit increase for hours spent on social media will decrease the self-improvement
by 0.863 unit
Correlations
Selfimntovemeot
Y: 5.705
HRS
Socialmedia
Y-intercept interpretation: on average, if social media is at 0, self-improvement will be at 5.705
SefimprovementHRS
Pearson Correlation
1
-.606"
Future prediction: If social media decreases, then self-improvement should increase.
SelfimprovementHRS
Expert Solution
This question has been solved!
Explore an expertly crafted, step-by-step solution for a thorough understanding of key concepts.

This is a popular solution!

Trending now
This is a popular solution!

Step by step
Solved in 5 steps

Knowledge Booster


Learn more about
Need a deep-dive on the concept behind this application? Look no further. Learn more about this topic, statistics and related others by exploring similar questions and additional content below.Recommended textbooks for you
College Algebra
Algebra
ISBN:
9781305115545
Author:
James Stewart, Lothar Redlin, Saleem Watson
Publisher:
Cengage Learning

Functions and Change: A Modeling Approach to Coll…
Algebra
ISBN:
9781337111348
Author:
Bruce Crauder, Benny Evans, Alan Noell
Publisher:
Cengage Learning

Glencoe Algebra 1, Student Edition, 9780079039897…
Algebra
ISBN:
9780079039897
Author:
Carter
Publisher:
McGraw Hill
College Algebra
Algebra
ISBN:
9781305115545
Author:
James Stewart, Lothar Redlin, Saleem Watson
Publisher:
Cengage Learning
Functions and Change: A Modeling Approach to Coll…
Algebra
ISBN:
9781337111348
Author:
Bruce Crauder, Benny Evans, Alan Noell
Publisher:
Cengage Learning
Glencoe Algebra 1, Student Edition, 9780079039897…
Algebra
ISBN:
9780079039897
Author:
Carter
Publisher:
McGraw Hill

Big Ideas Math A Bridge To Success Algebra 1: Stu…
Algebra
ISBN:
9781680331141
Author:
HOUGHTON MIFFLIN HARCOURT
Publisher:
Houghton Mifflin Harcourt