Test interviews of two personnel evaluation techniques are available, the first requires a two-hour test interview while the second can be completed in less than an hour. The table below is the output of the regression analysis of the 15 individuals who took both tests: (i) Calculate the sample correlation coefficient between Test 1 and Test 2 (ii) if the correlation of determination between test 1 and test 2 is M. Comment on the value of this correlation determination.
Test interviews of two personnel evaluation techniques are available, the first requires a two-hour test interview while the second can be completed in less than an hour. The table below is the output of the regression analysis of the 15 individuals who took both tests: (i) Calculate the sample correlation coefficient between Test 1 and Test 2 (ii) if the correlation of determination between test 1 and test 2 is M. Comment on the value of this correlation determination.

Functions and Change: A Modeling Approach to College Algebra (MindTap Course List)
6th Edition
ISBN:9781337111348
Author:Bruce Crauder, Benny Evans, Alan Noell
Publisher:Bruce Crauder, Benny Evans, Alan Noell
Chapter5: A Survey Of Other Common Functions
Section5.6: Higher-degree Polynomials And Rational Functions
Problem 12SBE

Related questions
Question
Test interviews of two personnel evaluation techniques are available, the first requires a two-hour test interview while the second can be completed in less than an hour. The table below is the output of the
(i) Calculate the sample
(ii) if the correlation of determination between test 1 and test 2 is M. Comment on the value of this correlation determination.
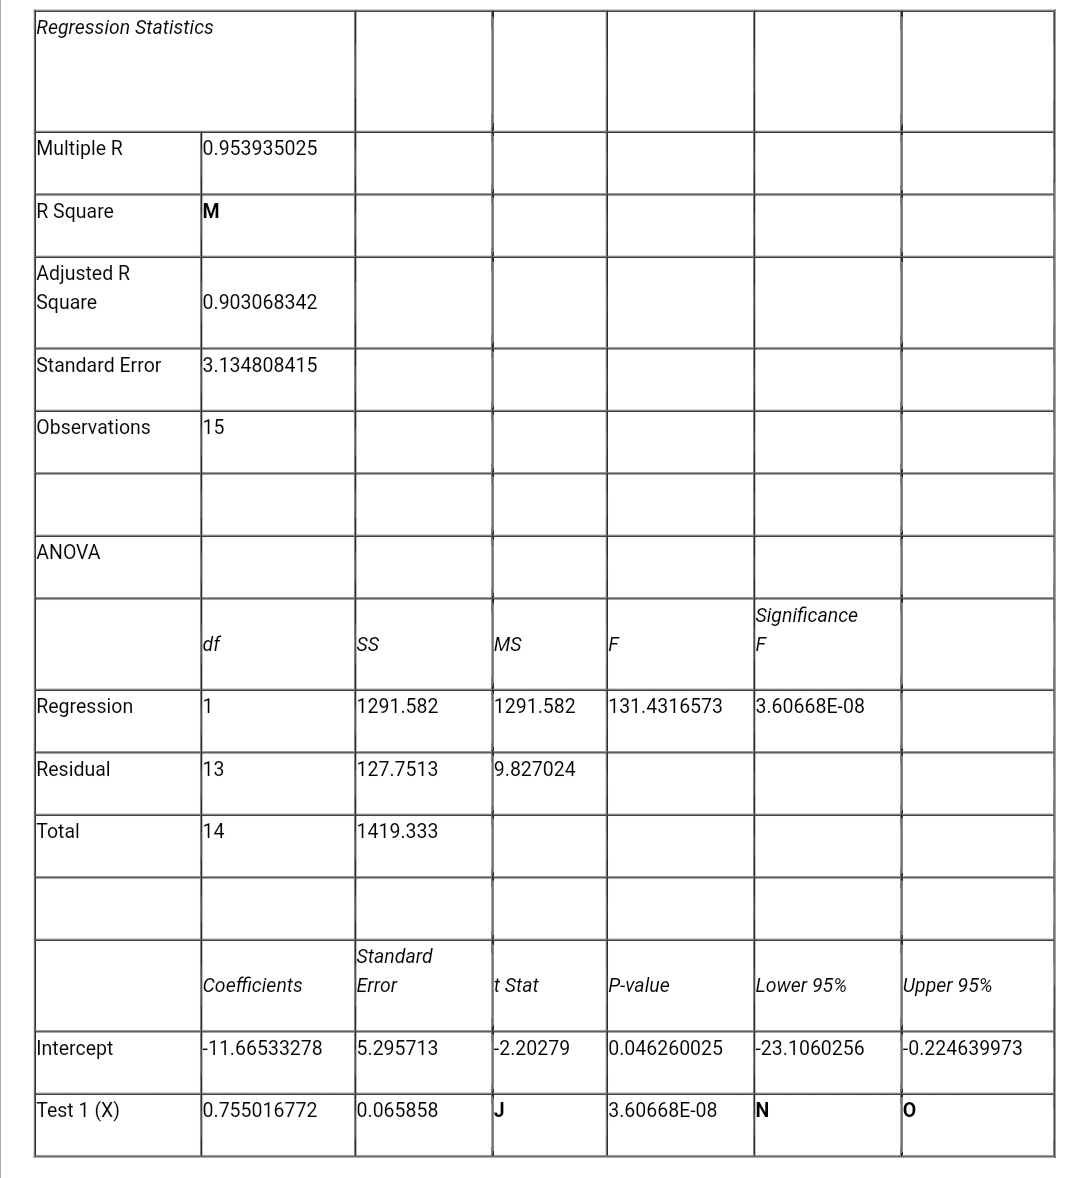
Transcribed Image Text:Regression Statistics
Multiple R
0.953935025
R Square
Adjusted R
Square
0.903068342
Standard Error
3.134808415
Observations
15
ANOVA
Significance
df
SS
MS
F
F
Regression
1
1291.582
1291.582
131.4316573
3.60668E-08
Residual
13
127.7513
9.827024
Total
14
1419.333
Standard
Coefficients
Error
t Stat
P-value
Lower 95%
Upper 95%
Intercept
11.66533278
5.295713
-2.20279
0.046260025
-23.1060256
-0.224639973
Test 1 (X)
0.755016772
0.065858
J
3.60668E-08
IN
Expert Solution
This question has been solved!
Explore an expertly crafted, step-by-step solution for a thorough understanding of key concepts.

Step by step
Solved in 3 steps

Recommended textbooks for you
Functions and Change: A Modeling Approach to Coll…
Algebra
ISBN:
9781337111348
Author:
Bruce Crauder, Benny Evans, Alan Noell
Publisher:
Cengage Learning

Glencoe Algebra 1, Student Edition, 9780079039897…
Algebra
ISBN:
9780079039897
Author:
Carter
Publisher:
McGraw Hill

Functions and Change: A Modeling Approach to Coll…
Algebra
ISBN:
9781337111348
Author:
Bruce Crauder, Benny Evans, Alan Noell
Publisher:
Cengage Learning
Glencoe Algebra 1, Student Edition, 9780079039897…
Algebra
ISBN:
9780079039897
Author:
Carter
Publisher:
McGraw Hill

Algebra & Trigonometry with Analytic Geometry
Algebra
ISBN:
9781133382119
Author:
Swokowski
Publisher:
Cengage


Algebra and Trigonometry (MindTap Course List)
Algebra
ISBN:
9781305071742
Author:
James Stewart, Lothar Redlin, Saleem Watson
Publisher:
Cengage Learning