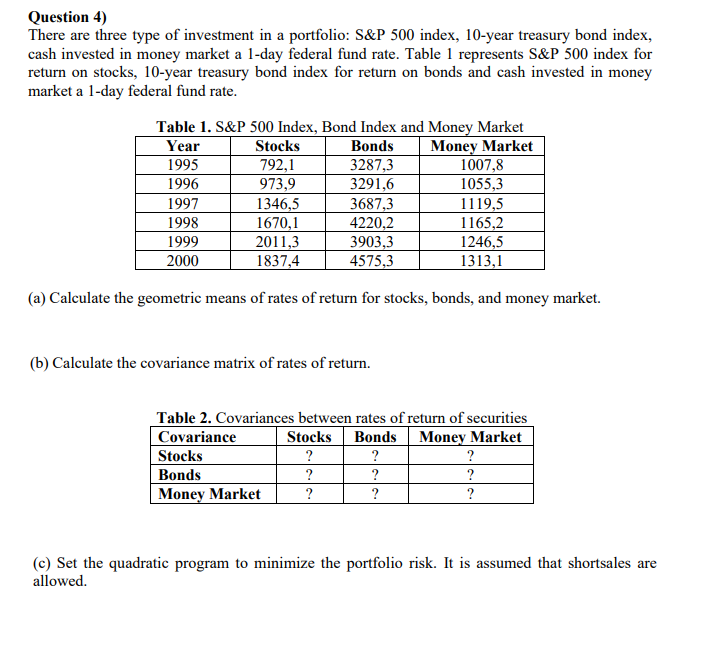
Question 4) There are three type of investment in a portfolio: S&P 500 index, 10-year treasury bond index, cash invested in money market a 1-day federal fund rate. Table 1 represents S&P 500 index for return on stocks, 10-year treasury bond index for return on bonds and cash invested in money market a 1-day federal fund rate. Table 1. S&P 500 Index, Bond Index and Money Market Money Market 1007,8 Year Stocks 792,1 973,9 Bonds 1995 3287,3 1996 3291,6 1055,3 1997 1346,5 1670,1 2011,3 1837,4 3687,3 4220,2 3903,3 4575,3 1119,5 1165,2 1998 1999 1246,5 1313,1 2000 (a) Calculate the geometric means of rates of return for stocks, bonds, and money market. (b) Calculate the covariance matrix of rates of return. Table 2. Covariances between rates of return of securities |Covariance Stocks Bonds Money Market Stocks Bonds Money Market ? ? ? ? ? ? ? ? ? (c) Set the quadratic program to minimize the portfolio risk. It is assumed that shortsales are allowed.
Question 4) There are three type of investment in a portfolio: S&P 500 index, 10-year treasury bond index, cash invested in money market a 1-day federal fund rate. Table 1 represents S&P 500 index for return on stocks, 10-year treasury bond index for return on bonds and cash invested in money market a 1-day federal fund rate. Table 1. S&P 500 Index, Bond Index and Money Market Money Market 1007,8 Year Stocks 792,1 973,9 Bonds 1995 3287,3 1996 3291,6 1055,3 1997 1346,5 1670,1 2011,3 1837,4 3687,3 4220,2 3903,3 4575,3 1119,5 1165,2 1998 1999 1246,5 1313,1 2000 (a) Calculate the geometric means of rates of return for stocks, bonds, and money market. (b) Calculate the covariance matrix of rates of return. Table 2. Covariances between rates of return of securities |Covariance Stocks Bonds Money Market Stocks Bonds Money Market ? ? ? ? ? ? ? ? ? (c) Set the quadratic program to minimize the portfolio risk. It is assumed that shortsales are allowed.

Algebra and Trigonometry (MindTap Course List)
4th Edition
ISBN:9781305071742
Author:James Stewart, Lothar Redlin, Saleem Watson
Publisher:James Stewart, Lothar Redlin, Saleem Watson
Chapter10: Systems Of Equations And Inequalities
Section10.FOM: Focus On Modeling: Linear Programming
Problem 14P

Related questions

Concept explainers
Contingency Table
A contingency table can be defined as the visual representation of the relationship between two or more categorical variables that can be evaluated and registered. It is a categorical version of the scatterplot, which is used to investigate the linear relationship between two variables. A contingency table is indeed a type of frequency distribution table that displays two variables at the same time.
Binomial Distribution
Binomial is an algebraic expression of the sum or the difference of two terms. Before knowing about binomial distribution, we must know about the binomial theorem.
Topic Video
Question
Transcribed Image Text:Question 4)
There are three type of investment in a portfolio: S&P 500 index, 10-year treasury bond index,
cash invested in money market a 1-day federal fund rate. Table 1 represents S&P 500 index for
return on stocks, 10-year treasury bond index for return on bonds and cash invested in money
market a 1-day federal fund rate.
Table 1. S&P 500 Index, Bond Index and Money Market
Bonds
3287,3
Money Market
1007,8
Year
Stocks
1995
792,1
1996
973,9
3291,6
1055,3
1997
1346,5
1670,1
2011,3
1837,4
3687,3
4220,2
3903,3
4575,3
1119,5
1165,2
1998
1999
1246,5
2000
1313,1
(a) Calculate the geometric means of rates of return for stocks, bonds, and money market.
(b) Calculate the covariance matrix of rates of return.
Table 2. Covariances between rates of return of securities
Covariance
Stocks
Stocks Bonds
Money Market
?
?
Bonds
?
?
?
Money Market
?
?
?
(c) Set the quadratic program to minimize the portfolio risk. It is assumed that shortsales are
allowed.
Expert Solution
This question has been solved!
Explore an expertly crafted, step-by-step solution for a thorough understanding of key concepts.

This is a popular solution!

Trending now
This is a popular solution!

Step by step
Solved in 2 steps with 1 images

Knowledge Booster


Learn more about
Need a deep-dive on the concept behind this application? Look no further. Learn more about this topic, statistics and related others by exploring similar questions and additional content below.Recommended textbooks for you
Algebra and Trigonometry (MindTap Course List)
Algebra
ISBN:
9781305071742
Author:
James Stewart, Lothar Redlin, Saleem Watson
Publisher:
Cengage Learning
Algebra and Trigonometry (MindTap Course List)
Algebra
ISBN:
9781305071742
Author:
James Stewart, Lothar Redlin, Saleem Watson
Publisher:
Cengage Learning