QUESTION 8b The Swamp Palace Museum (SPM) is an interactive museum that teaches visitors the ways of life on the swamps of the southern United States. Visitors can visit over 100 exhibits demonstrating the ecology of the swamp and the habits of the animals and insects that call the swamp home. Additionally, the museum includes several fast-food and full service restaurants and opportunity for swimming and several thrill rides. The park was originally supported with one time government funding but now it has to become self-supporting. After five years of operation, the park has not lacked for visitors but has struggled just to break-even. The Swamp Palace has sought help from the Marketivity Group to help them address the long-term viability of the park. Several technologies are considered as ways of enhancing value. One is a mobile phone app that will provide oral and visual navigation aids around the park. For instance, if someone says “take me to the Blind Bayou Bar,” the phone will give directions using prominent museum landmarks. Second, Swamp Palace is considering subscribing to an Internet coupon program that would provide patrons with discounts. Marketivity implements a quasi-experimental design over a one-week period in August. A sample of 200 visitors is randomly intercepted before entering the park. Approximately half are given the opportunity to download a free navigation app for their cell phone. Similarly, about half are invited to go to a kiosk and download a coupon from the Internet. Upon exiting the park, the patrons are taken to a desk where they fill out a short questionnaire. The employee then keys the data into the computer. The variables are in the dataset that is posted on BB. Analysis You want to examine the relationship between ratings of the attractions (SQ2) and the rating of the admissions price as fair (PriceP). You also want to take into account the ratings of food quality at SPM (SQ3). Thus, you want to conduct an analysis that uses both SQ2 and SQ3 to predict PriceP. Run the appropriate test and report the p value for the ratings of food quality (SQ3). Report all three decimals. For the analysis you ran for question #8, what is the right conclusion? We do not reject H0. Ratings of food quality predict ratings of the admissions price as being fair. We accept H1. Ratings of food quality do predict ratings of the admissions price as being fair. We do not reject H0. Ratings of food quality do not predict ratings of the admissions price as being fair. We accept H1. Ratings of food quality do not predict ratings of the admissions price as being fair. QUESTION 8c For the analysis you ran for question #8, what is p-value for SQ2 (quality of attractions)? Report all three decimals. QUESTION 8d For the analysis you ran for question #8, what is the right conclusion? We accept H1. Ratings of attraction quality do not predict ratings of the admissions price as being fair. We do not reject H0. Ratings of attraction quality predict ratings of the admissions price as being fair. We do not reject H0. Ratings of attraction quality do not predict ratings of the admissions price as being fair. We accept H1. Ratings of attraction quality predict ratings of the admissions price as being fair.


QUESTION 8b
The Swamp Palace Museum (SPM) is an interactive museum that teaches visitors the ways of life on the swamps of the southern United States. Visitors can visit over 100 exhibits demonstrating the ecology of the swamp and the habits of the animals and insects that call the swamp home. Additionally, the museum includes several fast-food and full service restaurants and opportunity for swimming and several thrill rides.
The park was originally supported with one time government funding but now it has to become self-supporting. After five years of operation, the park has not lacked for visitors but has struggled just to break-even. The Swamp Palace has sought help from the Marketivity Group to help them address the long-term viability of the park.
Several technologies are considered as ways of enhancing value. One is a mobile phone app that will provide oral and visual navigation aids around the park. For instance, if someone says “take me to the Blind Bayou Bar,” the phone will give directions using prominent museum landmarks. Second, Swamp Palace is considering subscribing to an Internet coupon program that would provide patrons with discounts.
Marketivity implements a quasi-experimental design over a one-week period in August. A sample of 200 visitors is randomly intercepted before entering the park. Approximately half are given the opportunity to download a free navigation app for their cell phone. Similarly, about half are invited to go to a kiosk and download a coupon from the Internet. Upon exiting the park, the patrons are taken to a desk where they fill out a short questionnaire. The employee then keys the data into the computer. The variables are in the dataset that is posted on BB.
Analysis
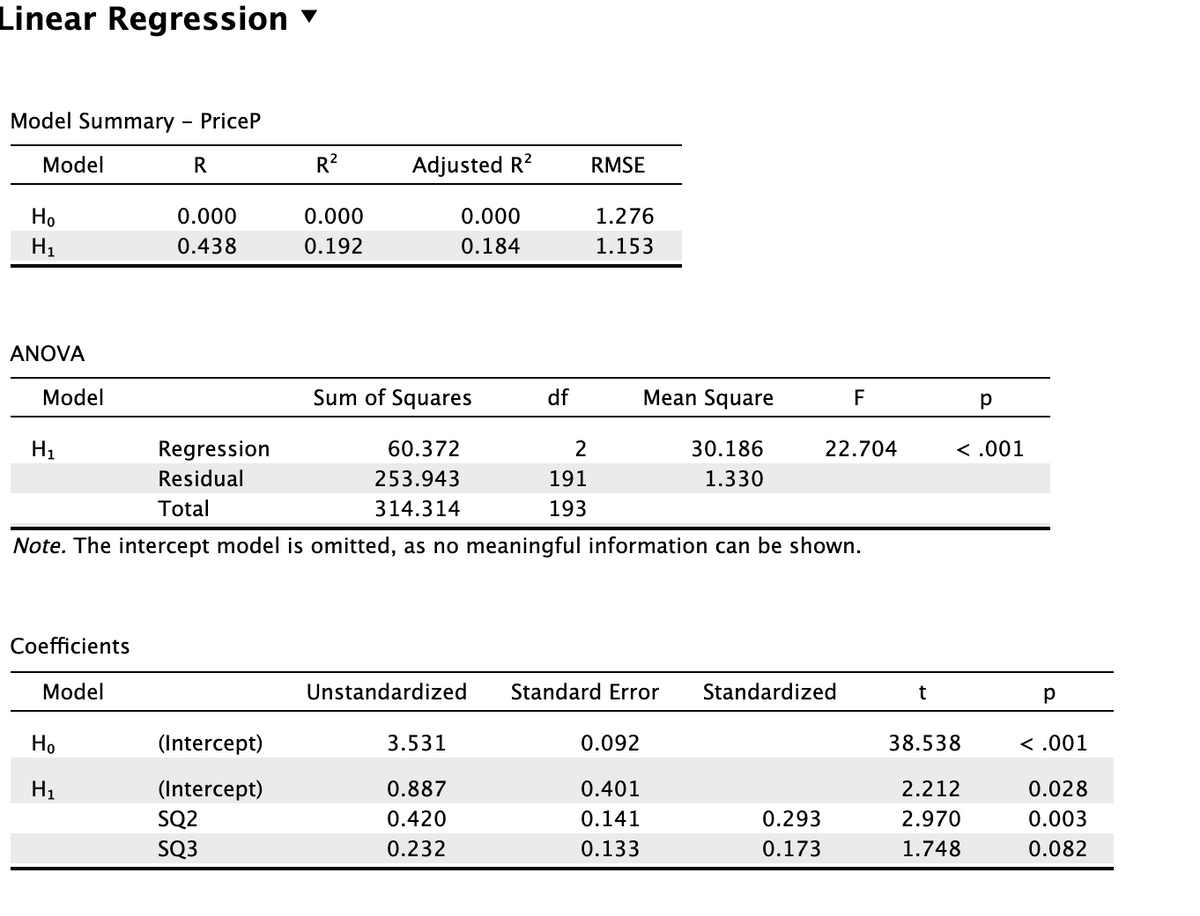
You want to examine the relationship between ratings of the attractions (SQ2) and the rating of the admissions price as fair (PriceP). You also want
to take into account the ratings of food quality at SPM (SQ3). Thus, you want to conduct an analysis that uses both SQ2 and SQ3 to predict PriceP. Run the
appropriate test and report the p value for the ratings of food quality (SQ3). Report all three decimals.
-
For the analysis you ran for question #8, what is the right conclusion?
We do not reject H0. Ratings of food quality predict ratings of the admissions price as being fair.
We accept H1. Ratings of food quality do predict ratings of the admissions price as being fair.
We do not reject H0. Ratings of food quality do not predict ratings of the admissions price as being fair.
We accept H1. Ratings of food quality do not predict ratings of the admissions price as being fair.
QUESTION 8c
-
For the analysis you ran for question #8, what is p-value for SQ2 (quality of attractions)? Report all three decimals.
QUESTION 8d
-
For the analysis you ran for question #8, what is the right conclusion?
We accept H1. Ratings of attraction quality do not predict ratings of the admissions price as being fair.
We do not reject H0. Ratings of attraction quality predict ratings of the admissions price as being fair.
We do not reject H0. Ratings of attraction quality do not predict ratings of the admissions price as being fair.
We accept H1. Ratings of attraction quality predict ratings of the admissions price as being fair.


Trending now
This is a popular solution!

Step by step
Solved in 2 steps


