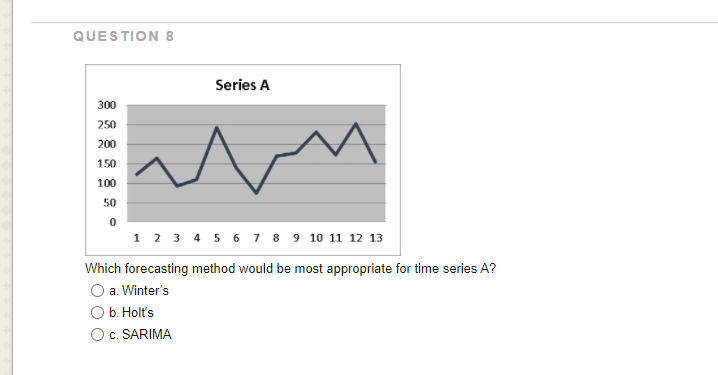
Series A 300 250 200 150 100 50 1 2 3 4 5 6 7 8 9 10 11 12 13 Which forecasting method would be most appropriate for time series A? O a. Winter's O b. Holt's


Q: 4. Compute four-period moving average and forecasting errors for the following time series: Period…
A: Given time series data:
Q: Passenger miles flown on Northeast Airlines, a commuter firm serving the Boston hub, are shown for…
A: *Answer: FORECAST(T + 1) = FORECAST + (ALPHA * (ACTUAL DEMAND - FORECAST)) FORECAST 2 = 15 + (0.22…
Q: Hudson Marine provides boats sales, service, and maintenance. Boat trailers are one of its top sales…
A: Seasonal variations are those variations that tend to repeat themselves over a period of time…
Q: Q5. What will be the value of GDP per capita in 2016, if the future value of Domestic Credit (% GDP)…
A: Let us define X1 be the future value of domestic credit = 178.37 X2 be the total investment = 28.42…
Q: Influenza Influenza Red Death Red Death (200 pop.) (900 pop.) (200 pop.) (900 pop.) Death Toll 1 26…
A: Note: Hey there! Thank you for the question. As per our understanding, we have assumed that 200 pop.…
Q: How do I find the critical value?
A: Given dataSignificance level α =0.05Right Tailed testDegrees of freedom is calculated by min(n1 – 1,…
Q: QUESTION 2 The annual interest rate for bank deposits in Euros is 0.025 while that on US dollar…
A: The answer to the above questions is as follows :
Q: 11. Which type of data is displayed in the table below? obene year hprice proglas surf bdrms brems…
A: Hello Thankyou for the question. According to our honor code can answer one question at a time.…
Q: ?? (0.301) + 3.024 male, ô = 5.11, R² = 0.08 (??) wagė %3D What is the interpretation of the…
A: wage^ = ?? (0.301)+ 3.024?? male - eq(1)σ ^=5.11R2 =0.08 What is the interpretation of the…
Q: 1. Use quantitative methods for the data shown below: Period 1 2 4 7 Observation| 24 34 36 37 41 44…
A:
Q: 13 12 11 10 8. 10 7 4 Os 3 2 - 1 4 6. 8 10 12 14 16 18 20 22 24 Education (in years) From this…
A: We have to find correct answer.
Q: a) Explain the differences between qualitative and quantitative forecasting techniques with…
A: a. Qualitative forecasting techniques: This is the kind of the forecasting which does not use data…
Q: Consider the following time series. 1 3 4 5 7 10 10 14 16 (a) Choose the correct time series plot.…
A: Excel Procedure: Enter t and yt in Excel>Data>Data Analysis> ‘Regression’>Select yt…
Q: What characteristics would you expect from a time series that describes the number of vehicles…
A: Times series: A set of observations on the values that a variable takes at different times.
Q: Economy A has reported the following data for unemployment and vacancy rate over time: Year…
A: We draw a scatter plot of Vacancy rate vs unemployment rate in Excel and try understand the trend.…
Q: We are hiring new housekeeping staff. We are interested in predicting how long we can expect our new…
A: Since you have posted question with multiple subparts,we will solve first three subparts for you.To…
Q: Month 1 23 4 5 6 Value 26 15 22 14 21 25 17 (a) Construct a time series plot. 30 30 30 20 15 15 10…
A: As per our guidelines, we are allowed to answer first three sub-parts only. Thanks Data : ta…
Q: Question No.2: How much population is increased from one decade to the other decade from the given…
A:
Q: (a) Compute four-week and five-week moving averages for the time series. 4-Week 5-Week Time Series…
A: In time series, a moving average is a statistical method generally used to estimate the trend…
Q: Sources Destinations Supply D1 D2 D3 D4 S1 20 10 5 7 10 S2 13 12 8. 20 S3 15 4 7 9. 30 S4 7 14 1 40…
A: Table 1: D1 D2 D3 D4 Supply Row penalty S1 20 10 5 7 10 7-5=2 S2 9 13 12 8 20 9-8=1 S3 15…
Q: Question 6, 10.2.17 = Homework: 5.4 Chapter 10 Homework HW Score: 23.22%, 13.93 of 60 points O…
A:
Q: What are the blanks?
A: (a).Use the online graphing calculator and plot the points as shown below.
Q: Companies are devoting time and energy to promote recycling. A major recycling company found some…
A:
Q: 1. The scatter plot shows the number of students at a middle school over time. Middle School…
A: We just need to analyse the graphs. Option B - there are 6 dots on one side of the line and 9 dots…
Q: Part 1: The Atlantic Tire and Muffler Company introduced a new line of all-season tires in January…
A: Since you have posted a question with multiple sub-parts, we will solve first three subparts for…
Q: A company that sells musical instruments has been in business for five years. During that time,…
A: Given a company that sells musical instruments has been in business for five years. The data is…
Q: The Carbondale Hospital is considering the purchase of a new ambulance. The decision will rest…
A: Provided data is; The miles driven during the past 5 years are as follows; Year 1 2 3 4 5…
Q: a. Plot the time series. b. Fit a three-year moving average to the data and plot the results. c.…
A: Here, we have a time series data from 2000 to 2016. The data gives measurement of shipment of…
Q: The table describes four possible outcomes for 2017, depending on the level of aggregate demand in…
A:
Q: Because of high tuition costs at state and private universities, enrollments at community colleges…
A: For the given data Find ( b ) b0 = ? b1 =? ( c ) forecast year 10
Q: ww.p Week 10 11 12 22 20 15 22 Actual Passenger Miles (in thousande) 17 21 19 23 18 16 20 18…
A: a) The formula for the forecast for exponential smoothing is given below:
Q: 4. Compute four-period moving average and forecasting errors for the following time series: Period…
A: Four period moving average: The four period moving average values are calculated as follows: Here,…
Q: Month Actual 3 month moving average 6 month moving average ( 4,3,2,1,1,1) August September 19 20…
A: Forecasting based question
Q: From March to April * anuary February March April May Remain steady Dramatical rise June Appr August…
A: We want to find correct answer.
Q: Demand for Month Bulldozers ЗМА Error 4MA Error 1 8 12 4 9. 15 11 10 8. 12 9? AE AE a) Compute…
A: a) Three month moving average for months 4-9 and Four month moving average for months 5-9. 3MA for…
Q: The values of building contracts (in $millions) for a 12-month period following. Compare a…
A: Note: Hi there! Thank you for posting the question. As your question has more than 3 parts, we have…
Q: Question 1: Find the trend for the time series using moving average method. Forecast Week 4…
A: Using moving average method,
Q: ONLINE ASSIGNMENT I (1) Adnan is the branch manager at a local insurance company. Recently, Adnan's…
A: Hi! Thank you for the question, As per the honour code, we are allowed to answer three sub-parts at…
Q: Time-Series Value Month Forecast 1 110 2 130 3 120 4 110
A: The exponential smoothing forecast can be obtained by using the formula- Ft+1=αYt+1-αFt Using α=0.2,…
Q: 15. Exponential Smoothing is usually applied to: A. SHORT-TERM FORECASTING B. LONG-TERM FORECASTING…
A: The object is to define the appropriate forecasting (long-term forecasting or short-term…
Q: 1. Which of the following is an example of time series problem? a. Estimating number of covid 19…
A: According to the answering guidelines, we can answer only one question at a time and the rest can be…
Q: Corporate triple-A bond interest rates for 12 consecutive months follow. 9.5 9.3 9.4 9.6 9.8 9.7 9.8…
A: The interest rates for 12 consecutive months is given as: Time (t) Interest rates (A) 1 9.5 2…
Q: 3. Compute three-period moving average and forecasting errors for the following time series: Period…
A: Given, Period (t): 1 2 3 4 5 6 7 8 9 Value (Xt): 15 27 20 14 25 11 20 25 18
Q: Question 2: Find the trend for the time series using moving average method. Forecast for Year 4…
A: using moving average method :
Q: Consider the following time series data. Week123 56 Value 19 11 16 10 17 12 (a) Construct a time…
A: Note: Hey there! Thank you for the question. As you have posted a question with several complete…
Q: Week 1 2 3 4 5 6 Value 18 13 16 11 17 14 Using the naive method (most recent value) as the…
A: Here, the forecast value is the previous week time series value.
Q: Statistics Question
A: Hey, since there are multiple subparts posted, we will answer first three question. If you want any…
Q: Corporate triple-A bond interest rates for 12 consecutive months follow. 9.5 9.3 9.4 9.6 9.8 9.7 9.8…
A: Given Information: A bond interest rates for 12 consecutive months are as follows: 9.5, 9.3, 9.4,…

Step by step
Solved in 2 steps

- Which of the following is NOT necessary for time series analysis? Question 7 options: Past data that spans at least five years. Past information about the variable being forecast Reasonable expectations that past patterns will extend into the future Past information that is quantified or quantifiableThe following plots have been obtained for a time series. a) Suggest an appropriate ARIMA model. b) The following ARIMA output has been obtained from R. Based on this output, which model would you recommend for forecasting?In the theory of time series, earthquakes can be considered as a. Seasonal Variation b. Cyclical Variation c. Irregular Variations d. Secular Trend
- Which of the following time series forecasting methods would not be used to forecast seasonal data?Exhibit 17-2Consider the following time series: t 1 2 3 4 Yi 4 7 9 10 Refer to Exhibit 17-2. The forecast for period 10 is ______. a. 10.0 b. 25.0 c. 22.5 d. 30.0Bob’s Garden Supply has seen the following annual demand for lime bags over the past 11 years. Year Bags (thousands) Year Bags (thousands) 1 7 7 9 2 10 8 11 3 8 9 12 4 9 10 10 5 10 11 14 6 8 a) Create a time series post. b) Develop a 2-year, 3-year, and 4-year moving averages. What is each forecast for year 12? c) Develop a 3-year weighted moving average in which the most recent year is given a weight of 2 and the other years are given a weight of 1. What is the forecast for year 12? d) Develop an exponential smoothing forecast with a smoothing constant of 0.4. Assume that the forecast for year 1 is 6,000 bags. What is the forecast for year 12? e) Calculate the MAD, MSE, and MAPE for each model in problems b, c, and d. Which model is the best predictor?
- Problem 6-05 Consider the following time series data. Choose the correct time series plot. (i) (ii) (iii) (iv) What type of pattern exists in the data? Develop a three-week moving average for this time series. Compute MSE and a forecast for week 7. If required, round your answers to two decimal places. Week Time SeriesValue Forecast 1 18 2 13 3 16 4 11 fill in the blank 3 5 17 fill in the blank 4 6 14 fill in the blank 5 MSE: fill in the blank 6The forecast for week 7: fill in the blank 7 Use α = 0.2 to compute the exponential smoothing values for the time series. Compute MSE and a forecast for week 7. If required, round your answers to two decimal places. Week Time SeriesValue Forecast 1 18 2 13 fill in the blank 8 3 16 fill in the blank 9 4 11 fill in the blank 10 5 17 fill in the blank 11 6 14 fill in the blank 12 MSE: fill in the blank 13The forecast for week 7: fill in the blank 14 Compare the three-week moving…corporate triple-a bond interest rates for 12 consecutive months follow.9.5 9.3 9.4 9.6 9.8 9.7 9.8 10.5 9.9 9.7 9.6 9.6a. construct a time series plot. What type of pattern exists in the data?Question 3 Hermie's average 5-day natural gas usage rate is 5.9Therms5days . What are her 1-day, and 8-day, natural gas usage rates? 1.18Therms1day,7.375Therms8days 0.7375Therms1day,9.44Therms8days 1.18Therms1day,9.44Therms8days 0.7375Therms1day,7.375Therms8days
- Describe the following time-series patterns: a. Horizontal Pattern b. Trend Pattern c. Seasonal Pattern d. Cyclical PatternThe Energy Information Administration of the U.S. Department of Energy providedtime series data for the U.S. average price per gallon of conventional regular gasolinebetween January 2007 and February 2014 (Energy Information Administration website,March 2014). Use the Internet to obtain the average price per gallon of conventionalregular gasoline since February 2014.a. Extend the graph of the time series shown in Figure 1.1.b. What interpretations can you make about the average price per gallon of conventionalregular gasoline since February 2014?c. Does the time series continue to show a summer increase in the average price pergallon? Explain.#2) Bob’s Garden Supply has seen the following annual demand for lime bags over the past 11 years. Year Bags (thousands) Year Bags (thousands) 1 7 7 9 2 10 8 11 3 8 9 12 4 9 10 10 5 10 11 14 6 8 a) Create a time series post. b) Develop a 2-year, 3-year, and 4-year moving averages. What is each forecast for year 12? c) Develop a 3-year weighted moving average in which the most recent year is given a weight of 2 and the other years are given a weight of 1. What is the forecast for year 12? d) Develop an exponential smoothing forecast with a smoothing constant of 0.4. Assume that the forecast for year 1 is 6,000 bags. What is the forecast for year 12? e) Calculate the MAD, MSE, and MAPE for each model in problems b, c, and d. Which model is the best predictor? f) Excel File


