QUESTION 53 Which of the following is the purpose of multiple regression analysis? (CHECK ALL THAT O To predict a response variable from several explanatory variables. To determine if there is a significant difference between several different groups. O To predict an explanatory variable based on values of several response variables. To predict an explanatory variable based on values of a response variable. QUESTION 54
QUESTION 53 Which of the following is the purpose of multiple regression analysis? (CHECK ALL THAT O To predict a response variable from several explanatory variables. To determine if there is a significant difference between several different groups. O To predict an explanatory variable based on values of several response variables. To predict an explanatory variable based on values of a response variable. QUESTION 54

College Algebra
7th Edition
ISBN:9781305115545
Author:James Stewart, Lothar Redlin, Saleem Watson
Publisher:James Stewart, Lothar Redlin, Saleem Watson
Chapter1: Equations And Graphs
Section: Chapter Questions
Problem 10T: Olympic Pole Vault The graph in Figure 7 indicates that in recent years the winning Olympic men’s...

Related questions
Question
Transcribed Image Text:O D
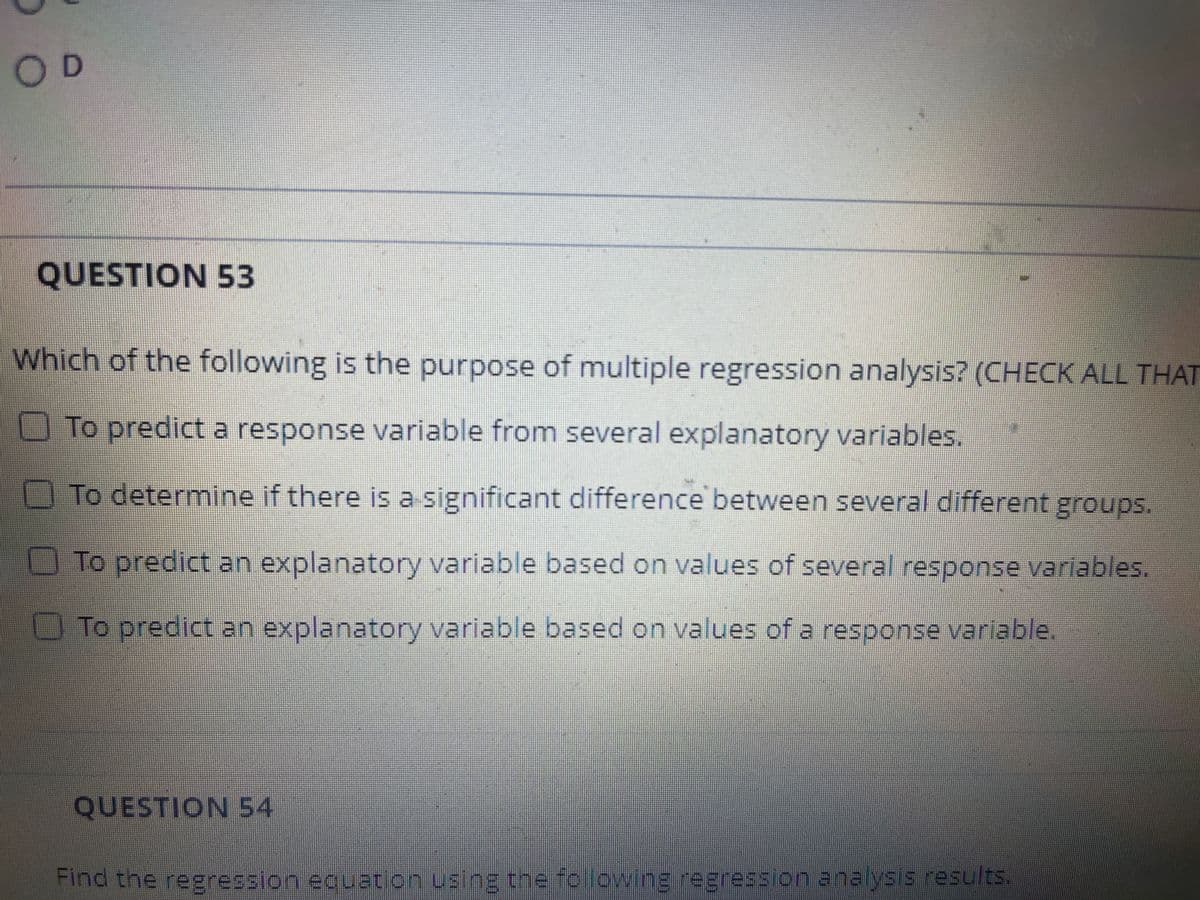
QUESTION 53
Which of the following is the purpose of multiple regression analysis? (CHECK ALL THAT
To predict a response variable from several explanatory variables.
To determine if there is a significant difference between several different groups.
To predict an explanatory variable based on values of several response variables.
To predict an explanatory variable based on values of a response variable.
QUESTION 54
Find the regression eguaton using the folowing regression analyss results.
Expert Solution
This question has been solved!
Explore an expertly crafted, step-by-step solution for a thorough understanding of key concepts.

Step by step
Solved in 2 steps

Recommended textbooks for you
College Algebra
Algebra
ISBN:
9781305115545
Author:
James Stewart, Lothar Redlin, Saleem Watson
Publisher:
Cengage Learning

Glencoe Algebra 1, Student Edition, 9780079039897…
Algebra
ISBN:
9780079039897
Author:
Carter
Publisher:
McGraw Hill

Algebra and Trigonometry (MindTap Course List)
Algebra
ISBN:
9781305071742
Author:
James Stewart, Lothar Redlin, Saleem Watson
Publisher:
Cengage Learning
College Algebra
Algebra
ISBN:
9781305115545
Author:
James Stewart, Lothar Redlin, Saleem Watson
Publisher:
Cengage Learning
Glencoe Algebra 1, Student Edition, 9780079039897…
Algebra
ISBN:
9780079039897
Author:
Carter
Publisher:
McGraw Hill
Algebra and Trigonometry (MindTap Course List)
Algebra
ISBN:
9781305071742
Author:
James Stewart, Lothar Redlin, Saleem Watson
Publisher:
Cengage Learning