Question 11 > The boxplot below shows salaries for Actuaries and CPAS. СРА Actuary 30 40 50 60 70 100 80 90 Salary (thousands of $)


Permutations and Combinations
If there are 5 dishes, they can be relished in any order at a time. In permutation, it should be in a particular order. In combination, the order does not matter. Take 3 letters a, b, and c. The possible ways of pairing any two letters are ab, bc, ac, ba, cb and ca. It is in a particular order. So, this can be called the permutation of a, b, and c. But if the order does not matter then ab is the same as ba. Similarly, bc is the same as cb and ac is the same as ca. Here the list has ab, bc, and ac alone. This can be called the combination of a, b, and c.
Counting Theory
The fundamental counting principle is a rule that is used to count the total number of possible outcomes in a given situation.
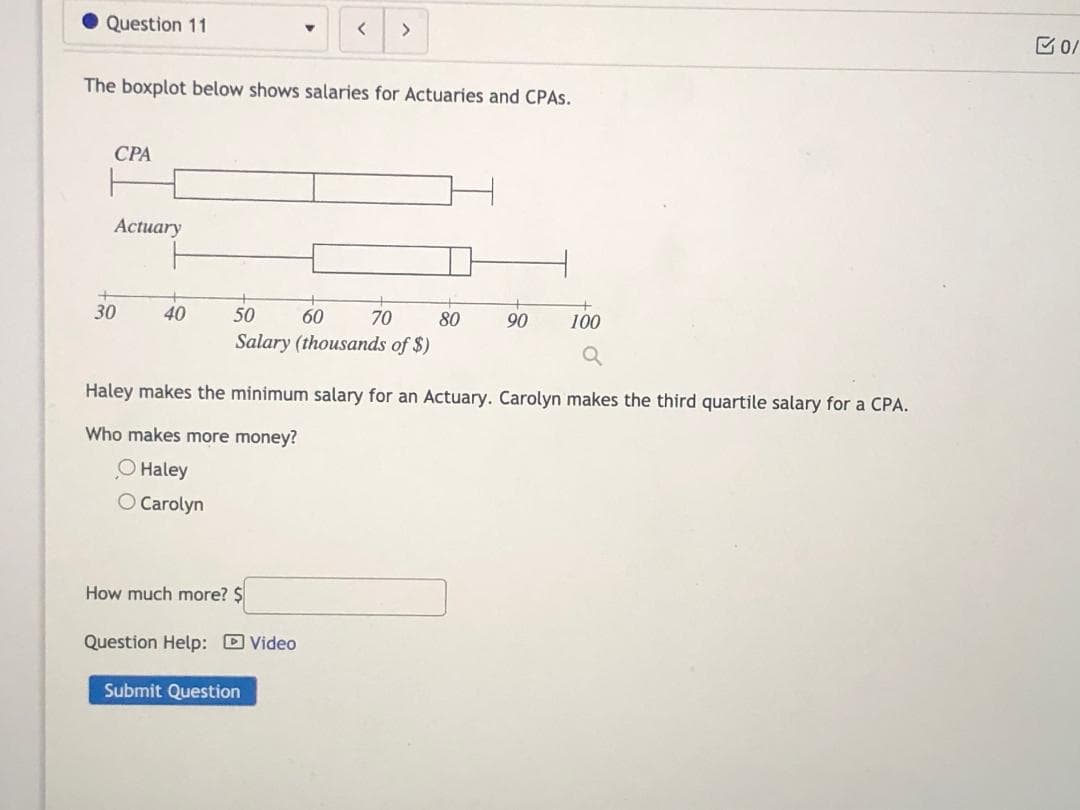
Two box plots for the salaries for Actuaries and CPAs are shown.
A box plot consists of:
- The far left of the chart (also known as end of the left whisker) symbolize the minimum (0%) of the data set.
- The starting line after the left whisker symbolize the first quartile Q1 (25%) of the data set.
- The middle line in the box symbolize the median Q2 (50%) of the data set.
- The ending line before the right whisker symbolize the third quartile Q3 (75%) of the data set.
- The far right of the chart (also known as end of the right whisker) symbolize the maximum (100%) of the data set.

Step by step
Solved in 2 steps with 1 images


