Question No. 4 A market trader sells ball-point pens on his stall. He sells the pens for a different fixed price, x pens, in each of six weeks. He notes the number of pens, y that he sells in each of these six weeks. The results are shown in following table. Week 1 4 5 Pens 10 15 20 25 30 35 Sells 68 60 55 48 38 32 a. Find the correlation coefficient between pens and sells and test the hypothesis that there is no relation between these variables. b. Find the regression equation of sells to pens c. Estimate the weekly sells for 20 pens. d. Estimate the Error.


Correlation
Correlation defines a relationship between two independent variables. It tells the degree to which variables move in relation to each other. When two sets of data are related to each other, there is a correlation between them.
Linear Correlation
A correlation is used to determine the relationships between numerical and categorical variables. In other words, it is an indicator of how things are connected to one another. The correlation analysis is the study of how variables are related.
Regression Analysis
Regression analysis is a statistical method in which it estimates the relationship between a dependent variable and one or more independent variable. In simple terms dependent variable is called as outcome variable and independent variable is called as predictors. Regression analysis is one of the methods to find the trends in data. The independent variable used in Regression analysis is named Predictor variable. It offers data of an associated dependent variable regarding a particular outcome.
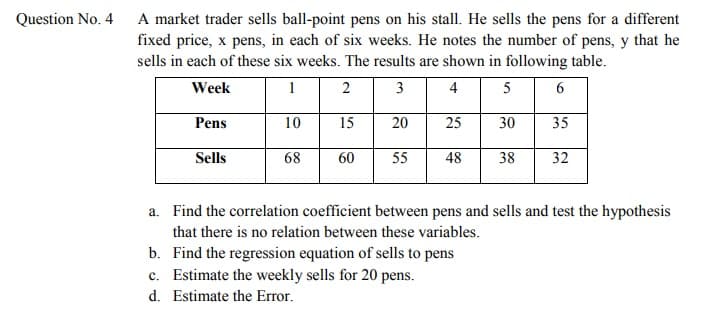
A market trader sells ball-point pens on his stall. He sells the pens for a different
fixed price, x pens, in each of six weeks. He notes the number of pens, y that he
sells in each of these six weeks. The results are shown in following table.
Week 1 2 3 4 5 6
Pens 10 15 20 25 30 35
Sells 68 60 55 48 38 32
a. Find the
that there is no relation between these variables.
b. Find the regression equation of sells to pens
c. Estimate the weekly sells for 20 pens.
d. Estimate the Error.


Trending now
This is a popular solution!

Step by step
Solved in 5 steps


