The following results are from data where the dependent variable is SALARY, the independent variables are AGE, EDUCATION, and FEMALE which is a dummy variable = 1 for females and = 0 for males. a) Complete the results
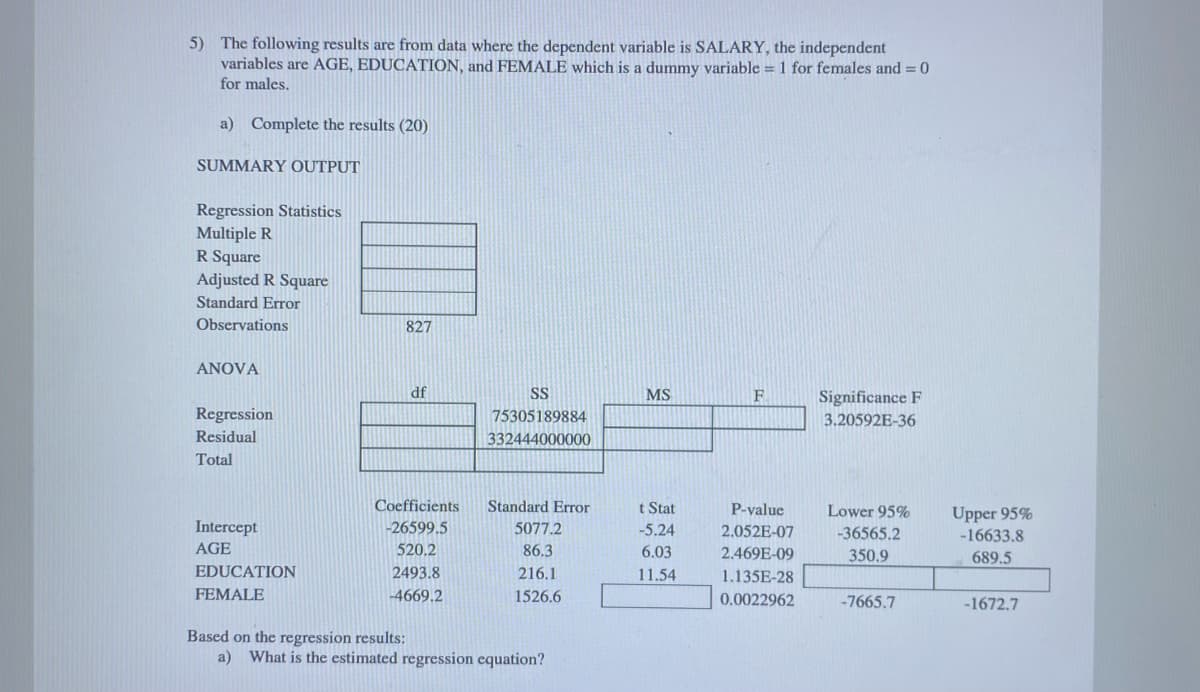
Q: "I really want to breast feed since i know breast milk has unique health benifits for the baby.But I...
A: Attribute is the variable which describe the characteristic of the population. There are different t...
Q: Suppose we take a SRS of high school seniors and get a 95% confidence interval that 250 to 278 senio...
A:
Q: Use the sample data and confidence level given below to complete parts (a) through (d). A research i...
A:
Q: Are your finances, buying habits, medical records, and phone calls really private? A real concern fo...
A: We have given that p = 46% = 0.46 n = 4
Q: The research team of a sophisticated and well-known hospital in the country is studying the occurren...
A: Let us assume a population of 100 patients to solve this problem. Let us denote R: Having R element...
Q: A student is taking an exam and doesn't know the answers to 3 of the questions, so they decide to gu...
A: Given: Student guess randomly One question with true/false question Second question with 3 possible ...
Q: Assume that a sample is used to estimate a population proportion p. Find the 95% confidence interval...
A: Given that n =227 ,x =129 Find the 95% confidence interval ? < p < ?
Q: According to a study done by a university student, the probability a randomly selected individual wi...
A: Solution
Q: If H, is false, the true or actual mean is equal the hypothesized mean, µ = Ho O True O False
A: We have given that the statement is about to the null hypothesis. Note: According to Bartleby expe...
Q: O It is never good to have sampling bias. O Statistics are not used to help understand the data coll...
A: In sampling, we always try to reduce the sampling bais. So, we can say that the it is nevertrue good...
Q: Q1. Which of these statements is incorrect? The diagram shows that A. F correlates positively with Y...
A: Definition Correlation of X and Y: Correlation may be defined as the linear relationship between th...
Q: Is the variable categorical or quantitative? Categorical (Qualitative) Quantitative (Numerical) inf...
A: We have given that Sample size n =13 liters Population mean μ =100 liters Sample mean =85.7 liters ...
Q: One-Sample Z: Test of u = 35 vs not = 35 The assumed standard deviation = 1.8 Variable N Мean StDev ...
A: For the given data perform One sample Z select the correct choices
Q: As a study being conducted by the state's Land Transportation Bureau, a random sample of 150 SUV own...
A:
Q: A sample is obtained from a population with m = 200 and s = 40. Which of the following samples woul...
A: Let M be the random variable from normal distribution with mean (μ) = 200 and standard deviation (σ)...
Q: Before changes to its management staff, an automobile assembly line operation had a scheduled mean c...
A:
Q: The following data shows the number of hours slept by a patient in 1 weeks 12 18 09 16 11 10 08
A: Given N=7 Confidence interval=95%
Q: The probability that a patient recovers from a stomach disease is 0.8. Suppose that 100 people contr...
A: Givenprobability that a patient recovers from stomach disease(p)=0.8sample size(n)=100x~Binomial(n=1...
Q: and that they claim their batteries will last on average, 3 years with a variance of 1 year. A rando...
A: given data : 1.9,2.4,3.0,3.5,4.2 from the above given data sample size,n= 5 ...
Q: The Trend Value (using Regression) for Quarter 1 of 2002 is O 235.94 O 355.98 O 229.23 O 277.95
A: Trend value is the value of Y of regression equation for particular x value.
Q: One-Sample Z: Test of u = 35 vs not = 35 The assumed standard deviation = 1.8 Variable Мean StDev SE...
A: The population mean is 35. We have to fill the given table. This is one sample z-test.
Q: As a study being conducted by the state's Land Transportation Bureau, a random sample of 150 SUV own...
A: From the given information, Sample size n =150 Sample mean, x̅=25,000 Sample standard deviation, s=5...
Q: Question 8 Question 8 options: Range of Data set 48, 26, 33, 50, 42
A: Given Number=48, 26, 33, 50, 42
Q: For the probability density function f defined on the random variable x, find (a) the mean of x, (b)...
A:
Q: The prime Minister of a small Caribbean Island stated that 95% of the population was vaccinated from...
A: Given data The prime minister of a small Caribbean island randomly selects 300 citizens and found th...
Q: The following table contains the probability distribution for the number of traffic accidents daily ...
A: Solution-: Let, X- be the number of accidents per day We have following table: X P(X) 0 0.28 ...
Q: Dunkins Corporation would like to buy insurance for their employee. The distributions are as follows...
A: Given the data as Betty, Carol & Emily Fendy & Qalid Loss outcome Probability Loss outc...
Q: Confidence intervals on the variance is very sensitive on the nomality of the data while the confide...
A:
Q: One of these is the correlation coefficient above. Identify the correlation coefficient.
A: Here use correlation coefficient
Q: Let X represent the full height of a certain species of tree. Assume that X has a normal probability...
A:
Q: CI on Mean, Variance Known As a study being conducted by the state's Land Transportation Bureau, a r...
A:
Q: At a college, 65% of courses have final exams and 45% of courses require research papers. Suppose th...
A:
Q: An old medical textbook states that the mean sodium level for healthy adults is 139 mEq per liter o...
A: Given Sample size=n=150, level of significance=ɑ=0.10, x̄=136, population standard deviations=σ=13 ...
Q: In a double-blind experiment designed to test the effectiveness of a new medication as a treatment f...
A: Given: 1643 patients were randomly assigned to one of three groups. 547 subjects in the placebo gro...
Q: For a normal distribution with M = 80 and SD = 12: (a) what is the probability of randomly selectin...
A:
Q: How many ways are there to choose 3 applicants from 8 job-seekers for high-paying positions in an en...
A: Given information- We have given that in an engineering company 3 positions are there and 8 job-seek...
Q: Salaries of 39 college graduates who took a statistics course in college have a mean, x, of $68,700....
A:
Q: he probability of rejecting the null hypothesis when it is false is also called the power of the tes...
A: According to guidelines we solve only first question when given questions are different.
Q: Find the critical value za/2 that corresponds to the given confidence level. 96% Za12 = (Round to tw...
A:
Q: For a random sample of 64 overweight men, the mean of the number of pounds that they were overweight...
A:
Q: Identify the distribution with the following moment generating functions (i) M, (t)= |0.3 +0.7e' ]" ...
A: It is known that the moment generating function uniquely identifies the corresponding distribution.
Q: The value of a should reflect the consequences of incorrectly rejecting H, if it is true True False
A: Given that Level of significance (α) We know that Type I error : Rejecting the null hypothesis ...
Q: 1. Interest centers around the life of an electronic component. Suppose it is known that the probabi...
A: Note- Since you have posted multiple questions, as per our guidelines we are supposed to answer only...
Q: describe the sampling distribution of the sample means in the histogram
A: A histogram of sample mean is given.
Q: In a survey of 3332 adults aged 57 through 85 years, it was found that 80.7% of them used at least...
A:
Q: According to the CDC, the average weight of men in 1990 was 181 pounds. Consider a claim that the a...
A: Given: Hypothesis test
Q: d. Is this a one-sided or a two-sided test? e. What would be the P-value if the alternative hypothes...
A: Given: H0:μ=35 vs H1:μ≠35 σ=1.8
Q: You receive a brochure from a large university. The brochure indicates that the mean class size for...
A: Introduction: Denote μ as the true mean class size for full-time faculty.
Q: (b) What is the 95% confidence interval estimate of the population mean examination score if a sampl...
A:
Q: I need help with stats, I am on section 6.3 (please help with TI-84 commands) Thanks A researcher w...
A:
Trending now
This is a popular solution!
Step by step
Solved in 2 steps
- A restaurant chain introduces new dishes on its menu and wants to know if this will increase the number of customers in its branches. According to the data of the chain, 20 students did not suffer changes in their affluence, 6 had a drop in their number of clients and 12 presented An increase with a significance level of 0.05 uses a non-parametric test to reject or accept the null hypothesis that the instruction of new dishes does not generate changes in the flow of dinersA manufacturer of salad dressings uses machines to dispense liquid ingredients into bottles that move along a filling line. The machine that dispenses salad dressings is working properly when 8 ounces are dispensed. Suppose that the average amount dispensed in a particular sample of 35 bottles is 7.91 ounces with a variance of 0.03 ounces squared. Is there evidence that the machine should be stopped and production wait for repairs? The lost production from a shutdown is potentially so great that management feels that the level of significance in the analysis should be 99%. (solve without excel)A manufacturer of salad dressings uses machines to dispense liquid ingredients into bottles that move along a filling line. The machine that dispenses salad dressings is working properly when 8 ounces are dispensed. Suppose that the average amount dispensed in a particular sample of 35 bottles is 7.91 ounces with a variance of 0.03 ounces squared. Is there evidence that the machine should be stopped and production wait for repairs? The lost production from a shutdown is potentially so great that management feels that the level of significance in the analysis should be 99%.
- Test the hypothesis that the average weekly allowance of female and male ACC 215 students the same, at 5%l evel of significance. Weekly Allowance of Students (Php) Male: 1500 2000 2500 2500 2000 1750 2000 1800 Female:1500 2000 1750 1500 2000 2500 3000 3500 Ho: Ha: α = Decision Rule: Computation: Decision: Conclusion:An aircraft company wanted to predict the number of worker-hours necessary to finish the design of a new plane. Relevant explanatory variables were thought to be the plane’s top speed, its weight, and the number of parts it had in common with other models built by the company. A sample of 27 of the company’s planes was taken, and the following model was estimated:y = β0 + β1x1 + β2x2 + β3x3 + εwherey = design effort, in millions of worker-hoursx1 = plane’s top speed, in miles per hourx2 = plane’s weight, in tonsx3 = percentage number of parts in common with other modelsThe estimated regression coefficients were as follows:b1 = 0.661 b2 = 0.065 b3 = -0.018and the estimated intercept was 2.0.Predict design effort for a plane with a top speed of Mach 1.0, weighing 7 tons, and having 50% of itsparts in common with other models.A manufacturer of salad dressings uses machines to dispense liquid ingredients into bottles that move along a filling line. The machine works properly when 24.12 ounces of liquids are dispensed. Suppose that the average amount dispensed in a particular sample of 41 bottles is 20.65 ounces with a variance of 1.48 ounces squared. What is the test statistic to test the null hypothesis that the salad dressings machine dispenses 24.12 ounces of liquid ingredients against the alternative that the salad dressings machine dispenses liquid ingredients other than 24.12 ounces?
- Test the hypothesis that the average weekly allowance of female and male ACC 215 students the same, at 5%l evel of significance. (Step by step solution, manually, without using excel) Weekly Allowance of Students (Php) Male: 1500 2000 2500 2500 2000 1750 2000 1800 Female:1500 2000 1750 1500 2000 2500 3000 3500 Ho: Ha: α = Decision Rule: Computation: Decision: Conclusion:The article “Characterization of Highway Runoff in Austin, Texas, Area” (J. of Envir. Engr., 1998: 131–137) gave a scatterplot, along with the least squares line, of x = rainfall volume (m3) and y = runoff volume (m3) for a particular location. The accompanying values were read from the plot. x <‐ c(5, 12, 14, 17, 23, 30, 40, 47, 55, 67, 72, 81, 96, 112, 127) y <‐ c(4, 10, 13, 15, 15, 25, 27, 46, 38, 46, 53, 70, 82, 99, 100) Test at level 0.05 whether there is a useful linear relationship between rainfall and runoff,and then calculate a 95% confidence interval for the true average change in runoff volumeassociated with one unit (one m3) increase in rainfall volume.Suppose a study reported that the average persin watched 3.37 hours of television per day. a random sample of 15 people gave the number of hours of television watched per day shown below. at the 1% significance level, do the data provide sufficent evidence to conclude that the amount of television watched per day last year by the average person is greater than the value reported in the study? A.select the correct parameter. a.the average number of hours that all people watch tv b. the average number of hours that the 15 people watch tv c. the fraction of hours people watch tv d. the total number of hours that a person watches tv B. select the correct hypotheses: a. Ho: mu= 3.37 Ha: mu is greater than 3.37 b. Ho: mu=4.103 Ha: mu is greater than 4.103 c.Ho: p=3.37 Ha: p is less than 3.37 d.Ho: mu=3.37 Ha: mu is less than 3.37 C. which of following statements best describes the sampling distribution? a. the sampling distribution is normal with mean 3.37 hours and standard deviation…
- The Office of the University Registrar of Seoul University would like to know if the degree programs in College of Science and Math are equally preferred by students.The test claim that the proportions of the students enrolled are equal in each degree program at alpha=0.05 Using the data on the number of currently enrolled students in each gender (M of F) in each of the four degree programs, fill out the table below and find the: a. Chi-square critical Value b. Chi-square test statisticA manufacturer of sunflower oil uses machines to distribute liquid ingredients into bottles that move along a filling line. The machine that distributes is working properly when 8 ounces are distributed Suppose that the average amount distributed in a particular sample of 35 bottles is 7 91 0 ounces. Assume that the variance of the process is known to be 0.03 ounces squared. Is there evidence that the machine should be stopped (when not 8 ounces are distributed), and production wait for repairs? The lost production from a shutdown is potentially so great that management feels that the level of confidence in the analysis should be 99%A random sample of 20 newly-born baby boys showed an average weight of 7.40 pounds while a sample of 25 newly-born baby girls showed a mean weight of 6.50 pounds. If the variance of all newly-born babies are 1.25 pounds, can we say that newly-born baby boys are heavier than newly-born baby girls using the 0.05 level?