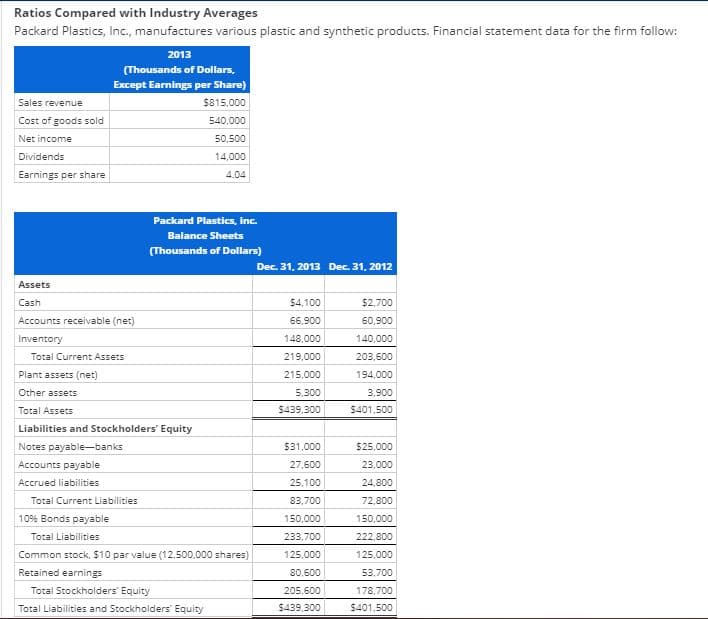
Ratios Compared with Industry Averages Packard Plastics, Inc., manufactures various plastic and synthetic products. Financial statement data for the firm follow: 2013 (Thousands of Dollars, Except Earnings per Share) Sales revenue $815,000 Cost of goods sold 540,000 Net income 50,500 Dividends 14,000 Earnings per share 4.04 Packard Plastics, inc. Balance Sheets (Thousands of Dollars) Dec. 31, 2013 Dec. 31, 2012 Assets Cash 54,100 $2,700 Accounts receivable (net) 66.900 60,900 Inventory 148,000 140,000 Total Current Assets 219,000 203,600 Plant assets (net) 215,000 194,000 Other assets 5.300 3,900 Total Assets $439.300 $401,500 Liabilities and Stockholders' Equity Notes payable-banks 531,000 $25.000 Accounts payable 27,600 23,000 Accrued liabilities 25.100 24,800 Total Current Liabilities 83,700 72,800 10% Bonds payable 150,000 150,000 Total Liabilities 233,700 222,800 Common stock, $10 par value (12,500.000 shares) 125.000 125,000 Retained earnings 80,600 53,700 Total Stockholders' Equity 205,600 178,700 Total Liabilities and Stockholders Equity $439,300 $401,500
Ratios Compared with Industry Averages Packard Plastics, Inc., manufactures various plastic and synthetic products. Financial statement data for the firm follow: 2013 (Thousands of Dollars, Except Earnings per Share) Sales revenue $815,000 Cost of goods sold 540,000 Net income 50,500 Dividends 14,000 Earnings per share 4.04 Packard Plastics, inc. Balance Sheets (Thousands of Dollars) Dec. 31, 2013 Dec. 31, 2012 Assets Cash 54,100 $2,700 Accounts receivable (net) 66.900 60,900 Inventory 148,000 140,000 Total Current Assets 219,000 203,600 Plant assets (net) 215,000 194,000 Other assets 5.300 3,900 Total Assets $439.300 $401,500 Liabilities and Stockholders' Equity Notes payable-banks 531,000 $25.000 Accounts payable 27,600 23,000 Accrued liabilities 25.100 24,800 Total Current Liabilities 83,700 72,800 10% Bonds payable 150,000 150,000 Total Liabilities 233,700 222,800 Common stock, $10 par value (12,500.000 shares) 125.000 125,000 Retained earnings 80,600 53,700 Total Stockholders' Equity 205,600 178,700 Total Liabilities and Stockholders Equity $439,300 $401,500

Financial Reporting, Financial Statement Analysis and Valuation
8th Edition
ISBN:9781285190907
Author:James M. Wahlen, Stephen P. Baginski, Mark Bradshaw
Publisher:James M. Wahlen, Stephen P. Baginski, Mark Bradshaw
Chapter5: Risk Analysis
Section: Chapter Questions
Problem 1AIC: Compute the values of each of the ratios in Exhibit 5.27 for Starbucks for 2012. Starbucks had 749.3...

Related questions
Question
Please help. Thanks
Transcribed Image Text:Ratios Compared with Industry Averages
Packard Plastics, Inc, manufactures various plastic and synthetic products. Financial statement data for the firm follow:
2013
(Thousands of Dollars,
Except Earnings per Share)
Sales revenue
$815.000
Cost of goods sold
540,000
Net income
50,500
Dividends
14,000
Earnings per share
4.04
Packard Plastics, inc.
Balance Sheets
(Thousands of Dollars)
Dec. 31, 2013 Dec. 31, 2012
Assets
Cash
$4,100
$2,700
Accounts receivable (net)
66.900
60,900
Inventory
148,000
140,000
Total Current Assets
219,000
203,600
Plant assets (net)
215.000
194,000
Other assets
5.300
3,900
Total Assets
$439.300
$401,500
Liabilities and Stockholders' Equity
Notes payable--banks
531,000
$25,000
Accounts payable
27,600
23,000
Accrued liabilities
25,100
24,800
Total Current Liabilities
83,700
72,800
10% Bonds payable
150,000
150,000
Total Liabilities
233,700
222,800
Common stock, $10 par value (12,500.000 shares)
125.000
125.000
Retained earnings
80,600
53,700
Total Stockholders' Equity
205,600
178,700
Total Liabilities and Stockholders' Equity
$439,300
$401,500
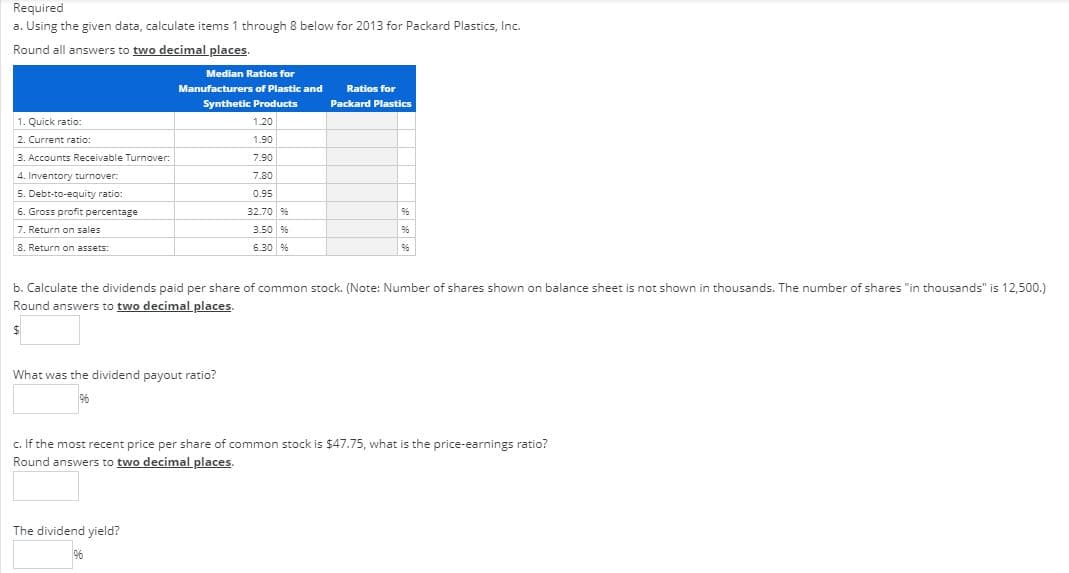
Transcribed Image Text:Required
a. Using the given data, calculate items 1 through 8 below for 2013 for Packard Plastics, Inc.
Round all answers to two decimal places.
Median Ratios for
Manufacturers of Plastic and
Ratios for
Synthetic Products
Packard Plastics
1. Quick ratio:
1.20
2. Current ratio:
1.90
3. Accounts Receivable Turnover:
7.90
4. Inventory turnover:
7.80
5. Debt-to-equity ratio:
0.95
6. Gross profit percentage
32.70 96%
9%
7. Return on sales
3.50 96%
96
8. Return on assets:
6.30 %
96
b. Calculate the dividends paid per share of common stock. (Note: Number of shares shown on balance sheet is not shown in thousands. The number of shares "in thousands" is 12,500.)
Round answers to two decimal places
What was the dividend payout ratio?
96
c. If the most recent price per share of common stock is $47.75, what is the price-earnings ratio?
Round answers
two decimalplaces.
The dividend yield?
96
Expert Solution
This question has been solved!
Explore an expertly crafted, step-by-step solution for a thorough understanding of key concepts.

This is a popular solution!

Trending now
This is a popular solution!

Step by step
Solved in 4 steps

Knowledge Booster


Learn more about
Need a deep-dive on the concept behind this application? Look no further. Learn more about this topic, accounting and related others by exploring similar questions and additional content below.Recommended textbooks for you
Financial Reporting, Financial Statement Analysis…
Finance
ISBN:
9781285190907
Author:
James M. Wahlen, Stephen P. Baginski, Mark Bradshaw
Publisher:
Cengage Learning

Survey of Accounting (Accounting I)
Accounting
ISBN:
9781305961883
Author:
Carl Warren
Publisher:
Cengage Learning

Financial Reporting, Financial Statement Analysis…
Finance
ISBN:
9781285190907
Author:
James M. Wahlen, Stephen P. Baginski, Mark Bradshaw
Publisher:
Cengage Learning
Survey of Accounting (Accounting I)
Accounting
ISBN:
9781305961883
Author:
Carl Warren
Publisher:
Cengage Learning


Managerial Accounting
Accounting
ISBN:
9781337912020
Author:
Carl Warren, Ph.d. Cma William B. Tayler
Publisher:
South-Western College Pub

EBK CONTEMPORARY FINANCIAL MANAGEMENT
Finance
ISBN:
9781337514835
Author:
MOYER
Publisher:
CENGAGE LEARNING - CONSIGNMENT