Recently, a researcher was visiting a local farmers market and sawa sign caining that grain-fed chicken are consistently larger than chickens fed any other type of diet. Skeptical about the claim, he creates an eperinent to see i type of det has an eflect en the weight of a chicken aumstick. He randonly assigns chickens to each of four diferent diets Diet , Diet 2, Diet3 nd Diet 4i and records the weight of each chickens heavier drumstick in grams). is there evidence of a difference in mean drumstic weight acros the four dets? What is the response variable? Select one: O a. Chickens O b. Drumstick weight O c. Diet O d. Grain-fed
Recently, a researcher was visiting a local farmers market and sawa sign caining that grain-fed chicken are consistently larger than chickens fed any other type of diet. Skeptical about the claim, he creates an eperinent to see i type of det has an eflect en the weight of a chicken aumstick. He randonly assigns chickens to each of four diferent diets Diet , Diet 2, Diet3 nd Diet 4i and records the weight of each chickens heavier drumstick in grams). is there evidence of a difference in mean drumstic weight acros the four dets? What is the response variable? Select one: O a. Chickens O b. Drumstick weight O c. Diet O d. Grain-fed

Glencoe Algebra 1, Student Edition, 9780079039897, 0079039898, 2018
18th Edition
ISBN:9780079039897
Author:Carter
Publisher:Carter
Chapter10: Statistics
Section10.6: Summarizing Categorical Data
Problem 10CYU

Related questions

Concept explainers
Contingency Table
A contingency table can be defined as the visual representation of the relationship between two or more categorical variables that can be evaluated and registered. It is a categorical version of the scatterplot, which is used to investigate the linear relationship between two variables. A contingency table is indeed a type of frequency distribution table that displays two variables at the same time.
Binomial Distribution
Binomial is an algebraic expression of the sum or the difference of two terms. Before knowing about binomial distribution, we must know about the binomial theorem.
Topic Video
Question
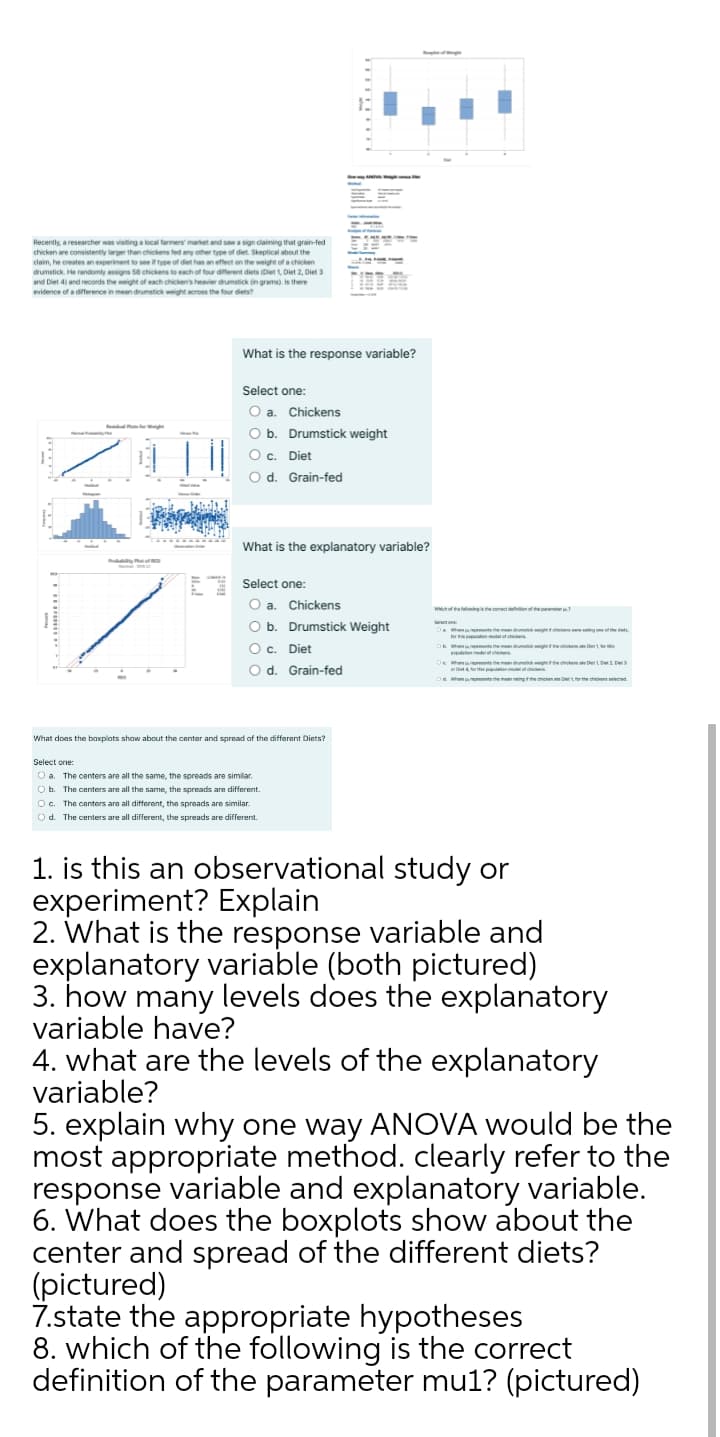
Transcribed Image Text:Recently, a researcher was visiting a local farmers market and saw a sign claiming that grain-fed
chicken are consistently larger than chickens fed any other type of diet. Skeptical about the
claim, he creates an experiment to see if type of diet has an effect on the weight of a chicken
drumstick. He randomly assigns 58 chickens to each of four different diets (Diet 1, Diet 2, Diet 3
and Diet 4) and records the weight of each chicken's heavier drumstick in grams). Is there
evidence of a difference in mean drumstick weight across the four diets?
What is the response variable?
Select one:
O a. Chickens
Ob.
Drumstick weight
O c. Diet
O d. Grain-fed
What is the explanatory variable?
Select one:
O a. Chickens
O b. Drumstick Weight
Ma ments the mean du g he
O c. Diet
L the ut rchickete Der hi
delon edelfce
h nt the mendu e ete DetLD
O d. Grain-fed
oa he ethe men ng n De the chicems eiecmd.
What does the baxplats show about the center and spread of the different Diets?
Select one:
O a. The centers are all the same, the spreads are similar.
O b. The centers are all the same, the spreads are different.
O c. The canters are all different, the spreads are similar
O d. The centers are all different, the spreads are different.
1. is this an observational study or
experiment? Explain
2. What is the response variable and
explanatory variable (both pictured)
3. how many levels does the explanatory
variable have?
4. what are the levels of the explanatory
variable?
5. explain why one way ANOVA would be the
most appropriate method. clearly refer to the
response variable and explanatory variable.
6. What does the boxplots show about the
center and spread of the different diets?
picture
7.state the appropriate hypotheses
8. which of the following is the correct
definition of the parameter mu1? (pictured)
Expert Solution
This question has been solved!
Explore an expertly crafted, step-by-step solution for a thorough understanding of key concepts.

Step by step
Solved in 3 steps with 1 images

Knowledge Booster


Learn more about
Need a deep-dive on the concept behind this application? Look no further. Learn more about this topic, statistics and related others by exploring similar questions and additional content below.Recommended textbooks for you
Glencoe Algebra 1, Student Edition, 9780079039897…
Algebra
ISBN:
9780079039897
Author:
Carter
Publisher:
McGraw Hill

Algebra & Trigonometry with Analytic Geometry
Algebra
ISBN:
9781133382119
Author:
Swokowski
Publisher:
Cengage

Holt Mcdougal Larson Pre-algebra: Student Edition…
Algebra
ISBN:
9780547587776
Author:
HOLT MCDOUGAL
Publisher:
HOLT MCDOUGAL
Glencoe Algebra 1, Student Edition, 9780079039897…
Algebra
ISBN:
9780079039897
Author:
Carter
Publisher:
McGraw Hill
Algebra & Trigonometry with Analytic Geometry
Algebra
ISBN:
9781133382119
Author:
Swokowski
Publisher:
Cengage
Holt Mcdougal Larson Pre-algebra: Student Edition…
Algebra
ISBN:
9780547587776
Author:
HOLT MCDOUGAL
Publisher:
HOLT MCDOUGAL