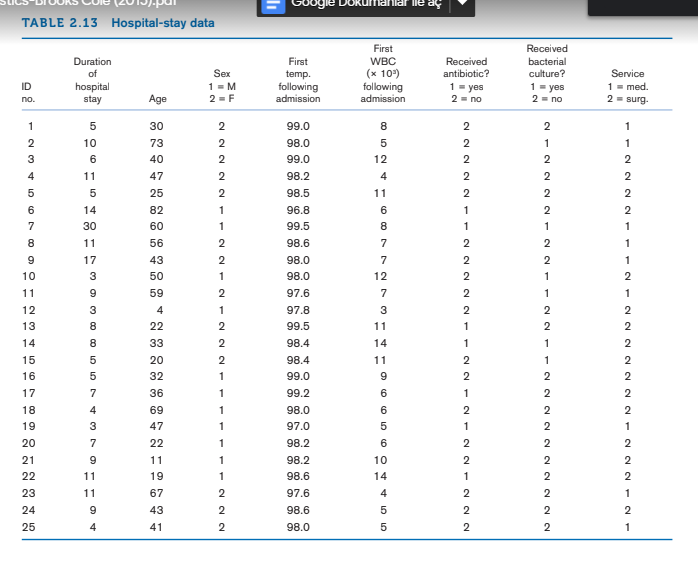
Refer to the data in images. Test for a significant difference in the variances of the initial white blood cell count between patients who did and patients who did not receive a bacterial culture.
Refer to the data in images. Test for a significant difference in the variances of the initial white blood cell count between patients who did and patients who did not receive a bacterial culture.

Glencoe Algebra 1, Student Edition, 9780079039897, 0079039898, 2018
18th Edition
ISBN:9780079039897
Author:Carter
Publisher:Carter
Chapter10: Statistics
Section10.3: Measures Of Spread
Problem 1GP

Related questions
Question
Refer to the data in images.
Test for a significant difference in the variances of the
initial white blood cell count between patients who did and
patients who did not receive a bacterial culture.
Transcribed Image Text:Google
lne aç
TABLE 2.13 Hospital-stay data
First
Received
Received
antibiotic?
1 = yes
2 = no
Duration
of
First
WBC
(x 10)
following
admission
bacterial
culture?
1 = yes
2- no
Service
1= med.
2 = surg.
Sex
temp.
ID
following
hospital
stay
1 = M
2 = F
Age
admission
no.
1
5
30
99.0
2
1
10
73
2
98.0
2
1
1
3
6
40
2
99.0
12
2
2
2
4
11
47
2
98.2
4
2
2
2
5
25
2
98.5
11
2
2
6.
14
82
96.8
6.
1
2
2
7
30
60
99.5
8
1
1
11
56
2
98.6
7
2
1
9
17
43
98.0
7
2
1
10
3
50
1
98.0
12
1
2
11
9
59
2
97.6
7
2
1
1
12
3
4
1
97.8
3
2
2
2
13
8
22
2
99.5
11
2
2
14
8
33
2
98.4
14
1
1
2
15
5
20
2
98.4
11
2
1
2
16
5
32
99.0
2
2
17
7
36
99.2
6
1
2
2
18
4
69
1
98.0
6
2
2
2
19
3
47
1
97.0
5
1
2
1
20
7
22
1
98.2
6
2
21
9
11
1
98.2
10
2
2
22
11
19
98.6
14
1
2
2
23
11
67
2
97.6
4
2
24
9
43
2
98.6
2
2
25
4
41
98.0
2
1
Expert Solution
This question has been solved!
Explore an expertly crafted, step-by-step solution for a thorough understanding of key concepts.

This is a popular solution!

Trending now
This is a popular solution!

Step by step
Solved in 2 steps with 4 images

Knowledge Booster


Learn more about
Need a deep-dive on the concept behind this application? Look no further. Learn more about this topic, statistics and related others by exploring similar questions and additional content below.Recommended textbooks for you
Glencoe Algebra 1, Student Edition, 9780079039897…
Algebra
ISBN:
9780079039897
Author:
Carter
Publisher:
McGraw Hill
Glencoe Algebra 1, Student Edition, 9780079039897…
Algebra
ISBN:
9780079039897
Author:
Carter
Publisher:
McGraw Hill