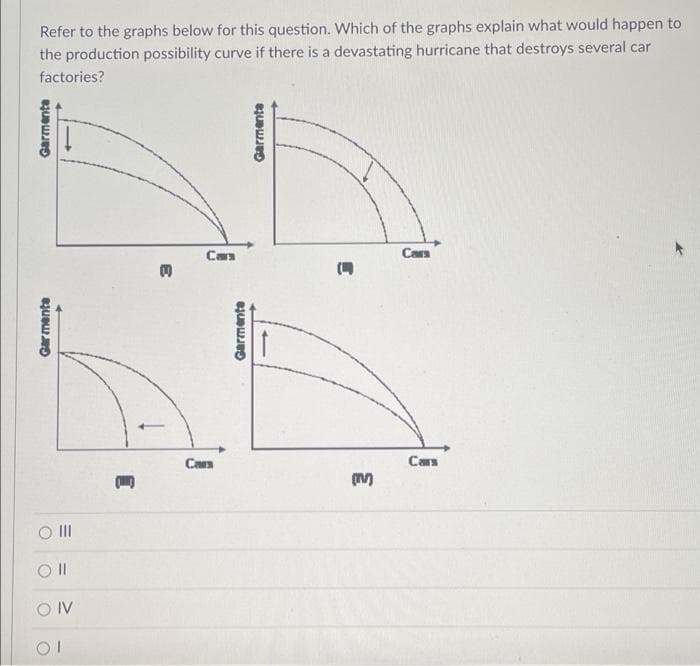
Refer to the graphs below for this question. Which of the graphs explain what woule the production possibility curve if there is a devastating hurricane that destroys sev factories? Caa Cars Cars Cars II O IV Gar menta Garmenta Garmenta


Q: What do you think would happen to a country's economy if there is too much imported goods?
A: International trade is the sale and purchase of commodities and services between countries…
Q: Assume the Canadian economy is currently in recession and the government budget is in deficit.…
A: The Phillips Curve is a graphical illustration of an economy's short-term unemployment and inflation…
Q: A favorable aggregate supply shock could result from: a.an increase in wages. b.a rapid rise in oil…
A: Aggregate supply shows different combinations of price and real output supplied.
Q: 2. Suppose John's utility function is UX,Y) = 4VXY , where X is consumption of beer and Y is…
A: A good has diminishing marginal utility when marginal utility decreases with increase in units of…
Q: In a market economy, firms with more workers can make and sell more output-that goes without saying.…
A: Total Revenue:- It means the sum of receipts which have been earned after the sale of any given…
Q: What is the difference between a point inside and a point on a PPC?
A: PPC shows different combinations of two goods x1 and x2 that can be produced with the use of given…
Q: ). Economic development is measured by. a) an increase in the aggregate level of output. O b) an…
A: The volume and variety of economic resources, as well as their equal distribution, are all…
Q: 5000 Find the consumers' surplus if the demand function for a particular beverage is given by D(q)…
A: D(q) = 5000(5q+9)2At Equilibrium Q = 5
Q: In this section, the context is a large negative shock to autonomous consumption in an open economy.…
A: The aggregate demand curve shows the inverse relationship between the price level and the total…
Q: proposing graph showing five year supply vs rental apartments in Downtown Denver, what do you think…
A: Lets understand the coordination between the manufacturing activity and consumption activity with a…
Q: The pandemic caused classes and exams to be cancelled at many universities. Some experts argue that…
A: The COVID-19 situation has had a more negative impact on the demand for lower-skilled occupations.…
Q: QUESTION 9 Look at the chart for problem #2 based on perfect competition. The total revenue of the…
A: Given information
Q: What kind of monetary policy can central banks carry out in the case of surplus in capital account…
A: Introduction Monetary policy will consist of the decision of the government and the central bank…
Q: 10. Calculate a joint probability given data: -Sample of 9000 firms. 6000 have CEO with Bachelor's…
A: Answer x=CEO has a Bachelor's Degree or a Ph. D related event =CEO with Bachelor's degree+CEO with…
Q: A regressive tax is a tax that requires people with people with lower incomes. incomes to pay a…
A: Progressive and regressive are two of different types of tax.
Q: Assume that the plum market has lots of different farms. They are producing pretty much the same…
A: A theoretical market structure is referred to as a perfect competition model. There are no…
Q: 5000 Find the consumers' surplus if the demand function for a particular beverage is given by Dg)…
A:
Q: Shield deodorant and Gucci Perfume are products that satisfy Physiological needs. True False…
A: 1. Shield deodorant and Gucci Perfume are products that satisfy Physiological needs. - FALSE
Q: uppose the computer industry receives an initial extra income for $100. Think about the multiplier…
A: Given: Equilibrium monthly wage = 1000 Equilibrium number of labors = 50
Q: Suppose the government proposes a relief package in an urgent attempt to bail out virtually all…
A: The answer is as follows:-
Q: Is globalisation a force for good in the world economy? Discuss with respect to at least three of…
A: Globalization is a phenomena characterized by rapid growth, resulting in significant changes on the…
Q: In a sunflower market, consumers have demand function for a sunflower given by P = -4Qd + 21 where…
A: Consumer surplus is the area above the price and below the demand curve. Producer surplus is the…
Q: Which good would you expect to have more elastic demand for each of the following pairs of goods,…
A: Elasticity of demand helps producers in estimating the response of consumers to any change in the…
Q: The primary goal of the safety net programs is to: Group of answer choices A)Support people who do…
A: Safety net programs are the programs which are made to help the poor people of the country. The main…
Q: what is the rational for a country that promotes free trade to put tariffs on some imported goods…
A: A levy is a duty forced by an overseeing expert on labor and products entering or leaving the nation…
Q: What does the purchaser of a product obtain besides the good, service, or idea itself?
A: Meaning of Production Function: The term production function refers to the situation under which a…
Q: Use the DD-AA model to discuss whether or not a devaluation under a fixed exchange rate has the same…
A: Robert Mundell and Fleming wrote the theorem when there was a fixed exchange rate system. The model…
Q: Potential real GDP is defined as: Group of answer choices The quantity of output that the economy…
A: Real GDP is the value of final goods and services produced in the economy within a given period of…
Q: a) falls as output increases. b) is constant. C) does not impact a firm's profit level.
A: Variable expenses are the expenses of the variable information sources (for example work). The best…
Q: Q4. Suppose the firm sells its output according to the following demand schedule: Labor Total…
A: Answer; Below I attached your answer
Q: Consider the following utility function: u(x1,x2) = x1 + x2. (A): i) Restate the consumer problem.…
A: * Hi there , as there are multiple questions posted . Following our guidelines we can only solve the…
Q: Many people in the U.S. are questioning the benefits of globalization as a result of recent global…
A: Globalization is an activity through which the countries enter into trade with each other.
Q: A deficit-financed increase in government purchases O A. crowds out investment by decreasing the…
A: “Since you have asked multiple question, we will solve the first question for you. If you want any…
Q: Using the following variables: Company Sales Force Commission of 3% and $500,000 in…
A: Given the sales force commission =3% Break-even sales volume = $50 million
Q: Calculate a Goal Value Standard using the following information: A x B x (C x D) = Item Value…
A: The variable cost is the cost that varies with the level of output produced. The cost does not…
Q: a perpetuity has a price of $750 and an annual interest payment of $35,
A:
Q: A company located in the US is selling a product in Japan for a price of exactly 7,175.5 Yen. The…
A: Price is yen = 7,175.5 yen Cost is = 56.5 $
Q: 14. Haynes Premier Breakfast has just raised the price of its popular biscuit. Assuming that the…
A: Elasticity measures the responsiveness of quantity demanded to changes in price level
Q: Explain the difference between positive and normative economics Consider the following two…
A: "Since you have posted multiple questions.We will solve first question for you.If you want specific…
Q: Two fish farmers are deciding how many fish to raise in a public access lake. The problem is that…
A: Benefit refers to the utility that a consumer derives from the consumption of an alternative. It is…
Q: In a repeated game of Bertrand competition, suppose two firms are playing the grim trigger strategy.…
A: Grim Trigger Strategy us defined as a strategy which is used on repeated prisoners dilemma where a…
Q: Consider the competitive market for titanium. Assume that, regardless of how many firms are in the…
A: Above the shutdown point, the supply curve is identical to the MC.
Q: Which good would you expect to have more elastic demand for each of the following pairs of goods,…
A: Concept: Price elasticity of demand refers to the change in the quantity demanded due to the change…
Q: You expect to receive the following: $4,448 at the end of each year for 12 years $22,900 today…
A: Given Cash Flow Amount 1 4448 At the end of each year for 12 years 2 22900 Today 3 3813…
Q: The initial cost of a pickup truck is $11,353 and will have a salvage value of $3.724 after five…
A: Hi! Thank you for the question as per the honour code, we’ll answer the first question since the…
Q: Diminishing marginal products means that if we double any one of K, N or L, output will less than…
A: In a market, a firm faces different phases of production when moving towards the production of more…
Q: 9.76 percent and the face value is $1,000
A:
Q: In a repeated game of Bertrand competition, suppose two firms are playing the grim trigger strategy.…
A: Grim Trigger Strategy us defined as a strategy which is used on repeated prisoners dilemma where a…
Q: INSTRUCTIONS: For each of the following, explain the effect on a) current account OR capital account…
A: (a) Interest rates have an impact on both consumer expenditure (imports) and the exchange rate,…
Q: Question 1. cost index is 1027 today and was 1450 four years ago, what is the estimated costs of the…
A: Given cost of the project 4 years ago = 250000 $ Cost index today 1027 Cost index four year ago =…


Trending now
This is a popular solution!

Step by step
Solved in 2 steps


- What does a production possibilities frontier illustrate?The Marope Economy has the capacity to produce the goods and services that are outlined in Table 1 below. You are required to:a. Draw a Production Possibility Frontier (PPF) and list all efficient points of production.b. Marope Economy wishes to produce 520 billion units of consumer goods. Plot this output onthe Frontier and state whether this is an efficient point or not.Table 1 – Production Possibilities Output (billions of units per year) Consumer goods Consumer servicesPart BA B480 420 0 120C D240 0 240 300 Use graphs to demonstrate how the following factors will change the PPF.a. A decrease in migrationb. An increase in natural resourcesc. Changes in technology(Shape of the PPF) Suppose a production possibilitiesfrontier includes the following combinations:Cars Washing Machines0 1,000100 600200 0a. Graph the PPF, assuming that it has no curvedsegments.b. What is the cost of producing an additional car when50 cars are being produced?
- Review the numbers for Canada and Venezuelafrom Table 33.12 which describes how many barrelsof oil and tons of lumber the workers can produce. Usethese numbers to answer the rest of this question.a. Draw a production possibilities frontier for eachcountry. Assume there are 100 workers in eachcountry. Canadians and Venezuelans desire bothoil and lumber. Canadians want at least 2,000tons of lumber. Mark a point on their productionpossibilities where they can get at least 3,000tons.b. Assume that the Canadians specializecompletely because they figured out they havea comparative advantage in lumber. They arewilling to give up 1,000 tons of lumber. Howmuch oil should they ask for in return for thislumber to be as well off as they were with notrade? How much should they ask for if theywant to gain from trading with Venezuela? Note:We can think of this “ask” as the relative price ortrade price of lumber.c. Is the Canadian “ask” you identified in (b) alsobeneficial for Venezuelans? Use the…Table 3-8 Production Possibilities Blankets Coats 8 600 12 ? 16 200 Refer to Table 3-8. If the production possibilities frontier is a straight line, then which of the following could represent the number of coats produced when 12 blankets are produced? a. 200 b. 500 c. 300 d. 400Evidence accumulates that the use of fertilizers, which increases agricultural production greatly, damages water quality. Explain in words how you would draw a production possibility curve to depict this (i.e. which good should be placed on each axis) and why your curve would have a particular shape.
- A nation with fixed quantities of resources is able to produce any of the following combinations of bread and ovens:Bread (tons) Oven (000’s)60 050 1240 2230 3020 3610 40 0 42These figures assume that a certain number of previously produced ovens are available in the current period for baking bread.a. Using data in the table, graph the ppf (with ovens on the vertical axis)b. What happens to the opportunity cost of bread – measured in number of ovens—as bread production increases from 0 to 10 tons, from 10 to 20 tons, from 20 to 30 tons, and so on?c. If this country chooses to produce both bread and ovens, what will happen to the ppf over time? Why? Select one:a. Remains stagnant b. Decline over time towards inefficiencyc. Increase over time and declined. Increase over time towards growthDescribe the linkage between “Scarcity” and each of the following;i. Choiceii. Opportunity Costiii. CompetitionThe first principle of economics in Chapter 1 is thatpeople face trade-offs. Use a production possibilitiesfrontier to illustrate society’s trade-off between two“goods”—a clean environment and the quantity ofindustrial output. What do you suppose determinesthe shape and position of the frontier? Show whathappens to the frontier if engineers develop anew way of producing electricity that emits fewerpollutants
- Sketch a plausible production possibility frontier that shows in general various combinations of wheat and potatoes a farmer can produce with the fixed amount of resources available to him? Label your diagram well for example your axesbut you dont have to use any specifc numberVistakon makes Acuvue TruEye and Acuvue Moist contact lenses. The following is Vistakon’s production possibilities frontier (PPF) for the two kinds of contact lenses. Use the graph to answer the questions below. If Vistakon is currently producing 2.5 billion Acuvue TruEye and 1.5 billion Acuvue Moist contact lenses per year, is it using its available resources efficiently or not? Why or why not? What is Vistakon’s opportunity cost of increasing Acuvue TruEye production from 1.5 billion to 2.5 billion lenses per year (in terms of Acuvue Moist contact lenses)? What will happen to the given Vistakon’s PPF if new technology facilitates production of Acuvue TruEye contact lenses? Show graphically (upload graphs below). What will happen to the given Vistakon’s PPF if materials for producing both kinds of contact lenses become more easily available and cheaper? Show graphically (upload graphs below).How can government involvement in an economy help or hinder the expansion of the production possibility frontier?
