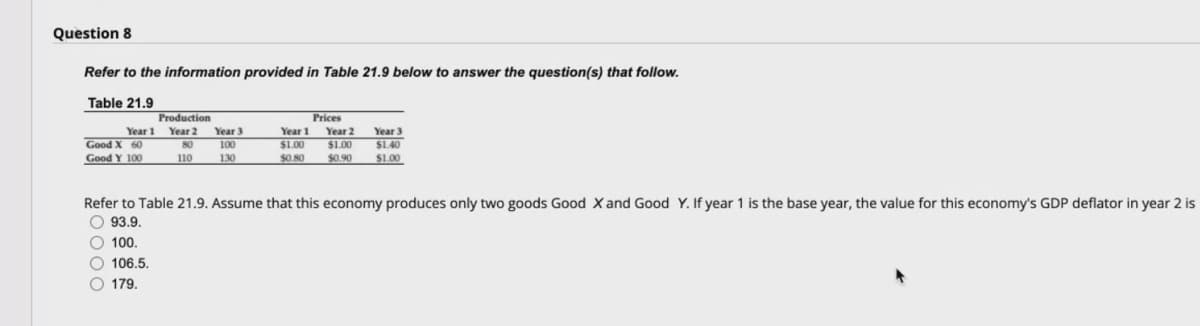
Refer to the information provided in Table 21.9 below to answer the question(s) that follow. Table 21.9 Production Year 2 Prices Year 1 Good X 60 Good Y 100 Year 3 Year 1 Year 2 Year 3 80 100 $1.00 $1.00 $1.40 110 130 $0.80 $0.90 S1.00 Refer to Table 21.9. Assume that this economy produces only two goods Good X and Good Y. If year 1 is the base year, the value for this economy's GDP deflator in year 2 is O 93.9. O 100. O 106.5. O 179.
Q: The price of crude oil during the period 2000-2010 can be approximated by P(t) = 6t + 18 dollars per…
A: Given, Q(t) = −0.08t2 + 1.2t + 5.5 million barrels per day (0 ≤ t ≤ 10).
Q: Q4: British Columbia (BC) produces lumber and films. Show the impact of each of the following events…
A: Hello, Thank you for the question. Since there are multiple subpart questions posted here, only the…
Q: 3. Consider the following statements. If P./ P, increases and a country exports cloth, production of…
A: The exchange of goods between individuals and entities for a specified payment is known as trade.…
Q: (plus symbols) represent three possible output levels in a given month. You can click on the points…
A: A (PPF), creation probability bend (PPC), or creation probability limit (PPB), or change…
Q: 7. Suppose a country produces three goods: Good X, Good Y and Good Z. The following table provides…
A: Gross domestic product is the market value of all goods and services produced within the country in…
Q: Suppose an economy produces steel, wheat, and oil. The steel industry produces $100,000 in revenue,…
A: 2) Gross Domestic Product or GDP is the sum total of the money value of all goods and services…
Q: 7. Suppose a country produces three goods: Good X, Good Y and Good Z. The following table provides…
A: The formula for GDP Deflator is: [(Nominal GDP)/(Real GDP)]*100 The formula for real GDP= sum of (…
Q: Consider the following table showing the breakdown of GDP (in billions) for China. GDP Category…
A: In economics, the final demand domestically can be defined as the total demand for final services…
Q: While the study of economic activities of individuals, households, and business at thesub-national…
A: Microeconomics is the investigation of choices made by individuals and organizations with respect to…
Q: Suppose an economy produces steel, wheat, and oil. The steel industry produces $100,000 in revenue,…
A: GDP or gross domestic product of a country is the total value (market or monetary) of the finished…
Q: All of the leather that this question refers to was produced in the US by the X Company in 2017.…
A: Final Goods: It refers to those goods which are either used for consumption or investment…
Q: Figure 2.12 b d y (Figure 2.12) Suppose the y axis of this graph represents consumer goods and the x…
A: The production possibility frontier (PPF) is a curve that depicts the different amounts of two items…
Q: Consider a simple economy with just two industries: farming and manufacturing. Farming consumes 1/2…
A:
Q: What are the three important macroeconomic goals about which most economists, and society at large,…
A: Macroeconomics: It relates to the whole economy.
Q: a. There is a trade-off between the amount of consumption that people can enjoy today and the amount…
A: a) The income of the person is limited. If he wants to consume it in future, he has to save it…
Q: Question 13 Refer to the information provided in Table 21.10 below to answer the question(s) that…
A: Real GDP when the good produced in the year valued at base year.
Q: Use the following graph to answer questions 2 and 3. Consumer Goods P (a) .L (b) Capital Goods 2.…
A: Given;
Q: Consider an economy with two firms and a government. Firm 1 produces 10000 units of good X, which it…
A: GDP computation through this approach requires adding up of all household income. It can be obtained…
Q: Refer to the information provided in Table 6.10 below to answer the question(s) that follow. Table…
A: Answer is A
Q: Which of the following statements best describes the correlation between changes in the GDP and…
A: The answer is - c. emissions are strongly linked to changes in GDP.
Q: Refer to the above table. Between years 1 and 2, real GDP grew by __________ percent in Alta:…
A: "Since you have asked multiple questions, we will solve first question for you .. If you want any…
Q: al producer and 10 million tons are imported. The steel producer produces 10 million tons of steel…
A:
Q: Refer to the information provided in Table 21.10 below to answer the question that follow. Table…
A:
Q: Refer to the information provided in Table 21.10 below to answer the question that follow. Table…
A: Real GDP formula =(Quantities in current year) (Price in base year)
Q: Oman is using capital - intensive methods of production. This statement is related to _____. a. For…
A: The economy has to decide on four major things. This is also called central problem of the economy.…
Q: Classify each of the following items as a final good or service or an intermediate good or service,…
A: The items that are being used for providing utility and satisfaction of human wants are known as…
Q: Q1: There are two equations for macroeconomic equilibrium in an economy. State them Show…
A: Macroeconomic equilibrium can be defined as a point wherein the amount of aggregate demand rises to…
Q: Suppose a country, Macroland, doesn't trade with other countries. Its GDP is $20 billion. Its…
A: GDP measures the market value of goods and services produced within an economy in a given period of…
Q: Category Expenditure (in billions of 2020 Q2 NZ Dollars) Household final consumption 40.3…
A: Total investment has two components: Depreciation, that is the expenditure on capital replacement,…
Q: An economy consists of three industries: an agricultural industry, a mining industry, and a…
A: An economy consists of three industries: an agricultural industry, a mining industry, and a…
Q: Consider an economy with three sectors: Fuels and Power, Manufacturing, and Services. Fuels and…
A:
Q: A simple economy consists of three industries: agriculture, manifacturing and services. The…
A: An economy is an integrated where the firms use the inputs of each other to produce some amount of…
Q: The data in columns 1 and 2 in the table below are for a private closed economy. (1) (2) (3) (4) (5)…
A: Note: Since you posted a question with multiple subparts, we will solve the first three subparts for…
Q: Consider an economy with three sectors: Fuels and Power, Manufacturing, and Services. Fuels and…
A: * Solution :-
Q: Production Prices Year 2 $1.20 S0.60 Year 2 Year 1 X 50 Y 100 Year 3 60 Year 1 $1.00 $(,60 Year 3…
A: Nominal GDP measures value of goods and services using current level of prices whereas real GDP uses…
Q: 1) Classify the following topics as relating to microeconomics or macroeconomics. (5) a. a family’s…
A: Microeconomics is a branch of economics that deals with issues concerning with one individual,…
Q: The following diagram presents a circular-flow model of a simple economy. The outer set of arrows…
A: The household sector needs goods & services for usage, therefore they attribute to the…
Q: What will be the impact of Covid 19 on global economy and local economic system? Explain.
A: The pandemic has spread quickly, affecting millions of people and bringing economic activities to a…
Q: Preamble for Questions 1-8. Consider a fish/fishing rod economy, with Crusoe and Friday the entire…
A: Y=1050 GDP = $4000 50 fishing rods created by Friday and 1000 fish caught by Crusoe. The price of…
Q: Use the concept of an economy-wide production possibilities to explain full employment output and…
A: Full employment in its entirety output is Pareto efficient. It means that the economy can't raise…
Trending now
This is a popular solution!
Step by step
Solved in 2 steps
- Consider a simple economy consisting of two countries, England and France. England has 25 workers and France has 75 workers. England can produce 4 units of grain and 2 units of cloth with each unit of labor. France can produce 1 unit of grain and 1 unit of cloth with each unit of labor. Wages per unit of labor are the same in both countries. c. Assume that consumers have utility ?=?????^(1/2) ⋅????ℎ^(1/2). How much does each country produce and consume of each good in autarky? Show the consumption graphically by drawing the indifference curves into your two diagrams. d. Now allow for trade. How much does each country produce and consume of each good in this case? Draw the new production possibilities frontier, indifference curves, and equilibrium point into your two diagrams, and indicate exports and imports. e. What is the utility of consumers in each country under free trade? How much does utility change relative to autarky?jamie has $100 that he can spend on milk and gas. A gallon of milk costs $5.However, government gives its citizens a coupon that entitles people to 20%discount on their first 10 gallon milk purchases. Gas costs $4 per gallon andgovernment charges $1 for each gallon of purchased gas. Jamies utility functionis U (x, y) = 9x+10y, where x and y represent gallons of milk and gas consumed,respectively. What is Jamies optimal consumption of milk and gas?Part bIf government removes the quantity restriction to which the coupon applies (i.e.20% discount is applied to any quantity of milk purchased), what will be jamieoptimal consumption?An economy depends on two basic products, wheat and oil. To produce 1 metric ton of wheat requires 0.23 metric tons of wheat and 0.32 metric tons of oil. Production of 1 metric ton of oil consumes 0.08 metric tons of wheat and 0.13 metric tons of oil. Find the production that will satisfy a demand for 500 metric tons of wheat and 870 metric tons of oil. The input-output matrix is Aequals left bracket Start 2 By 2 Matrix 1st Row 1st Column 0.23 2nd Column 0.08 2nd Row 1st Column 0.32 2nd Column 0.13 EndMatrix right bracket. [ ? ]metric tons of wheat is required to satisfy the demand.
- Given the significant increases in the cost of living in Canada (and elsewhere), Governments (both Federal and Provincial) have been under pressure to provide financial support to at last individuals or households. This financial support can be in the form of direct payments (income) to individuals or subsidizing the purchase of certain goods (i.e. the government pays a portion of the purchase price). To keep things simple, let’s only consider our standard example in which the individual consumes food and clothing; and food is the good whose purchase is to be subsidized. a) Evaluate the impact of both of these options on the utility of the individuals receiving support. (40%) b) Suppose the government only subsidizes the purchase of the first 5 units of food, how does this change your answer to a)? (40%) c) If the government ends up spending the same amount of total subsidies in either case (income support or price subsidy), which option will have a more substantial effect on the…Question 2 Figure 23-1 L W L N M B Refer to Figure 23-1. Which of the following pairs correctly identify W and Y? a. Markets for factors of production and markets for goods and services O b. Firms and households O c. Expenditures and income O d. Consumption and investment +Suppose that we are in a small, local economy that produces three goods. They are: (i) Food, (ii)Gas, and (iii) Housing. The prices for reach of these goods from 2019-2022 are:Good 2019 Price 2019 Quantity 2020 Price 2020 QuantityFood 10 12 14 15Gas 2 2 1.50 1.50Housing 2,000 2,500 2,200 1,800Good 2021 Price 2021 Quantity 2022 Price 2022 QuantityFood 12 15 15 16Gas 3 2 4 2.50Housing 2,300 2,200 2,400 2,3001. Calculate the Nominal GDP for this economy for 2019, 2020, 2021, and 2022. 2. Calculate Real GDP for this economy for 2019, 2020, 2021, and 2022, using the year 2019as the base year. 3. Calculate Real GDP for this economy for 2019, 2020, 2021, and 2022, using the year 2020as the base year. 4. Calculate the Real GDP Deflators for 2021 and 2022 using the Nominal GDPs youcalculated in Q1 and the Real GDPs you calculated in Q3.5. What is the annual inflation rate for 2022 according to the Real GDP Deflators youcalculated in Q4? Now suppose that the Local Government is interested in…
- 11) Suppose there are two goods, X and Y, with X measured on the horizontal axis and Y measured onthe vertical axis. Which of the following statements about a budget line relating the two goods is correct? The budget line shows all the possible combinations of X and Y a consumer can buy given the level of income and prices. The budget line shows all the possible combinations of X and Y a consumer can buy given the level of income, prices, and borrowings. The budget line shows the most preferred combinations of X and Y a consumer can buy given the level of income and prices. The budget line shows the least-cost combinations of X and Y a consumer will buy given the level of income and prices.Consider 2 goods with prices p1 = 4 and p2 = 6, and a consumer with income m = 200. The government imposes a sales tax on good 1. Suppose the sales tax is (a) a quantity tax t = 2 (dollars per unit). (b) an ad valorem tax of 30 per cent (t = 0.3). Compute and graph the consumer’s budget line without a tax, and for the taxes in (a) and (b), respectively.suppose the demand and supply equation for eggs in market is: Qd= 100-2p; Qs= 10+40p Complete the given table Graphically show the equilibrium Find PED: for 0.5 to 1.5 and 2.5 to 1.0 What happened to the eggs market if Government increases tax on poultry farm business and on the other hand consumer decreases the consumption of eggs because of reeducation in their income level (show and explain graphically) Price 0.5 1.0 1.5 2.0 2.5 Qd Qs
- Scenario 3 Suppose the government implements an income support program with the intention of making sure residents are able to purchase sufficient food. The government pays a cash benefit to all individuals with incomes less than $1000 according the following formula: cash benefit (CB) = $200 – 0.2*(earned income(I)) Households spend all of their income on food (F) and other goods (X). The price of food and other goods are normalized to 1. A households budget constraint is F + X = CB + I Households have the following preferences: U = 0.25*ln(F) + 0.75*ln(X) Refer to Scenario 3 Suppose instead of cash, the government benefit is in the form of food stamps, or vouchers, that must be spent on food. How much does the household spend on food now?Scenario 3 Suppose the government implements an income support program with the intention of making sure residents are able to purchase sufficient food. The government pays a cash benefit to all individuals with incomes less than $1000 according the following formula: cash benefit (CB) = $200 – 0.2*(earned income(I)) Households spend all of their income on food (F) and other goods (X). The price of food and other goods are normalized to 1. A households budget constraint is F + X = CB + I Households have the following preferences: U = 0.25*ln(F) + 0.75*ln(X) Refer to Scenario 3 Suppose a household has earned income of $300. How much does this household receive in benefits? and how much does the household spend on food?In this hypothetical economy, there are two consumers living over two periods of life. Ann’s incomes are $50,000 in both periods. Meanwhile, Bob earns nothing in the first period but $105,000 in the second period. Both of them can borrow or lend at the interest rate r. For simplicity, assume that there are no taxes. a) Assume that both Ann and Bob consume $50,000 in the first period and $50,000 in the second period. Write down the lifetime budget constraint for each consumer then calculate the interest rate r. Describe the economic behavior of each consumer. b) Suppose the interest rate increases. What will happen to Ann’s consumption in the first period? Is Ann better off or worse off than before the interest rate rises? Explain your answer using an appropriate diagram c) What will happen to Bob’s consumption in the first period when the interest rate increases? Is Bob better off or worse off than before the interest rate increases? Explain your answer using an…