Refer to the r (x-bar) chart in Section 8.2 Exercise 6 of the text. According to this 2 (x-bar) chart, is the process within statistical control? If not, provide a reason why not. a. It does not appear to be within b. It appears to be within statistical statistical control because at least control. one point is more extreme than the UCL or LCL. c. It does not appear to be within d. It does not appear to be within statistical control because there is statistical control because at least 8 an obvious non-random trend, consecutive points are located all cycle, or pattern in the points. above or all below the centerline.
Refer to the r (x-bar) chart in Section 8.2 Exercise 6 of the text. According to this 2 (x-bar) chart, is the process within statistical control? If not, provide a reason why not. a. It does not appear to be within b. It appears to be within statistical statistical control because at least control. one point is more extreme than the UCL or LCL. c. It does not appear to be within d. It does not appear to be within statistical control because there is statistical control because at least 8 an obvious non-random trend, consecutive points are located all cycle, or pattern in the points. above or all below the centerline.

Big Ideas Math A Bridge To Success Algebra 1: Student Edition 2015
1st Edition
ISBN:9781680331141
Author:HOUGHTON MIFFLIN HARCOURT
Publisher:HOUGHTON MIFFLIN HARCOURT
Chapter4: Writing Linear Equations
Section: Chapter Questions
Problem 11CT

Related questions
Question
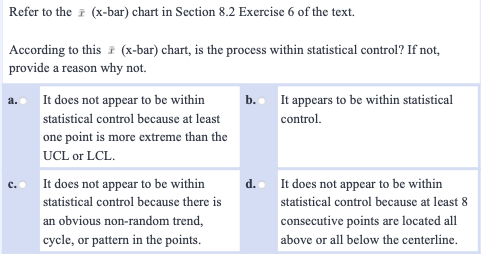
Refer to the (x-bar) chart in Section 8.2 Exercise 6 of the text.
According to this (x-bar) chart, is the process within statistical control? If not, provide a reason why not.
| a. | It does not appear to be within statistical control because at least one point is more extreme than the UCL or LCL. | b. | It appears to be within statistical control. |
|---|---|---|---|
| c. | It does not appear to be within statistical control because there is an obvious non-random trend, cycle, or pattern in the points. | d. | It does not appear to be within statistical control because at least 8 consecutive points are located all above or all below the centerline. |
Transcribed Image Text:Refer to the i (x-bar) chart in Section 8.2 Exercise 6 of the text.
According to this (x-bar) chart, is the process within statistical control? If not,
provide a reason why not.
It does not appear to be within
It appears to be within statistical
a.
b.
statistical control because at least
control.
one point is more extreme than the
UCL or LCL.
It does not appear to be within
d.
It does not appear to be within
statistical control because there is
statistical control because at least 8
an obvious non-random trend,
consecutive points are located all
cycle, or pattern in the points.
above or all below the centerline.
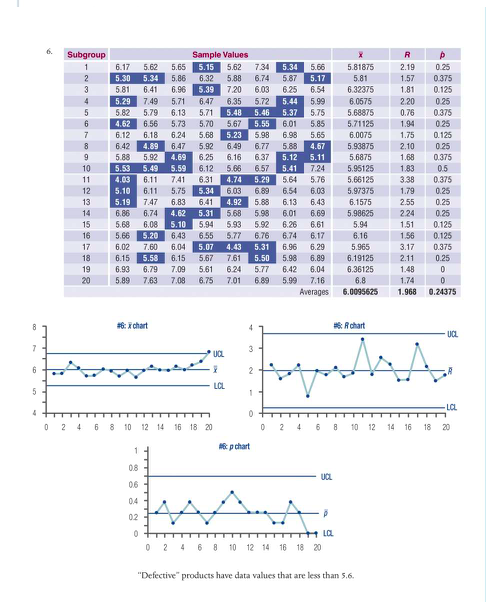
Transcribed Image Text:6.
Subgroup
Sample Values
R
1
6.17
5.62
5.65
5.15
5.62
7.34
5.34
5.66
5.81875
2.19
0.25
2
5.30
5.34
5.86
6.32
5.88
6.74
5.87
5.17
5.81
1.57
0.375
3
5.81
6.41
6.96
5.39
7.20
6.03
6.25
6.54
6.32375
1.81
0.125
4
5.29
7.49
5,71
6.47
6.35
5.72
5.44
5.99
6.0575
2.20
0.25
5.82
5.79
6.13
5.71
5.48
5.46
0.76
0.375
5.37
6.01
5.75
5.68875
6.
4.62
6.56
5.73
5.70
5.67
5.55
5.85
5.71125
1.94
0.25
7
6.12
6.18
6.24
5.68
5.23
5.98
6.98
5.65
6.0075
1.75
0.125
8
6.42
4.89
6.47
5.92
6.49
6.77
5.88
4.67
5.93875
2.10
0.25
9
5.88
5.92
4.69
6.25
6.16
6.37
5.12
5.11
5.6875
1.68
0.375
10
5.53
5.49
5.59
6.12
5.66
6.57
7.24
5.41
5.64
5.95125
1.83
0.5
4.03
6.11
7.41
6.31
4.74
5.29
5.76
5.66125
3.38
0.375
11
12
5.10
6.11
5.75
5.34
6.03
6.89
6.54
6.03
5.97375
1.79
0.25
13
5.19
7.47
6.83
6.41
4.92
5.88
6.13
6.43
6.1575
2.55
0.25
14
6.86
6.74
4.62
5.31
5.68
5.98
6.01
6.69
5.98625
2.24
0.25
5.68
6.08
5.20
15
5.10
5.94
5.93
5.92
6.26
6.61
5.94
1.51
0.125
16
5.66
6.43
6.55
5.77
6.76
6.74
6.17
6.16
1.56
0.125
17
6.02
7.60
6.04
5.07
4.43
5.31
6.96
6.29
5.965
3.17
0.375
18
6.15
5.58
6.15
5.67
7.61
5.50
5.98
6.89
6.19125
2.11
0.25
19
6.93
6.79
7.09
5.61
6.24
5.77
6.42
6.04
6.36125
1.48
20
5.89
7.63
7.08
6.75
7.01
6.89
5.99
7.16
6.8
1.74
Averages
6.0095625
1.968
0.24375
8
総chart
4.
* Rchart
UCL
UCL
6.
2
LCL
LCL
4
0 2 4 6 8 10 12 14 16 18 20
2 4
6
10 12
14 16 18
20
1
p chart
0.8
UCL
06
04
02
+ la
0 2 4 6 8 10 12 14 16 18 20
"Defective" products have data values that are less than 5.6.
Expert Solution
This question has been solved!
Explore an expertly crafted, step-by-step solution for a thorough understanding of key concepts.

This is a popular solution!

Trending now
This is a popular solution!

Step by step
Solved in 2 steps with 1 images

Knowledge Booster


Learn more about
Need a deep-dive on the concept behind this application? Look no further. Learn more about this topic, statistics and related others by exploring similar questions and additional content below.Recommended textbooks for you
Big Ideas Math A Bridge To Success Algebra 1: Stu…
Algebra
ISBN:
9781680331141
Author:
HOUGHTON MIFFLIN HARCOURT
Publisher:
Houghton Mifflin Harcourt

Linear Algebra: A Modern Introduction
Algebra
ISBN:
9781285463247
Author:
David Poole
Publisher:
Cengage Learning

Glencoe Algebra 1, Student Edition, 9780079039897…
Algebra
ISBN:
9780079039897
Author:
Carter
Publisher:
McGraw Hill
Big Ideas Math A Bridge To Success Algebra 1: Stu…
Algebra
ISBN:
9781680331141
Author:
HOUGHTON MIFFLIN HARCOURT
Publisher:
Houghton Mifflin Harcourt
Linear Algebra: A Modern Introduction
Algebra
ISBN:
9781285463247
Author:
David Poole
Publisher:
Cengage Learning
Glencoe Algebra 1, Student Edition, 9780079039897…
Algebra
ISBN:
9780079039897
Author:
Carter
Publisher:
McGraw Hill