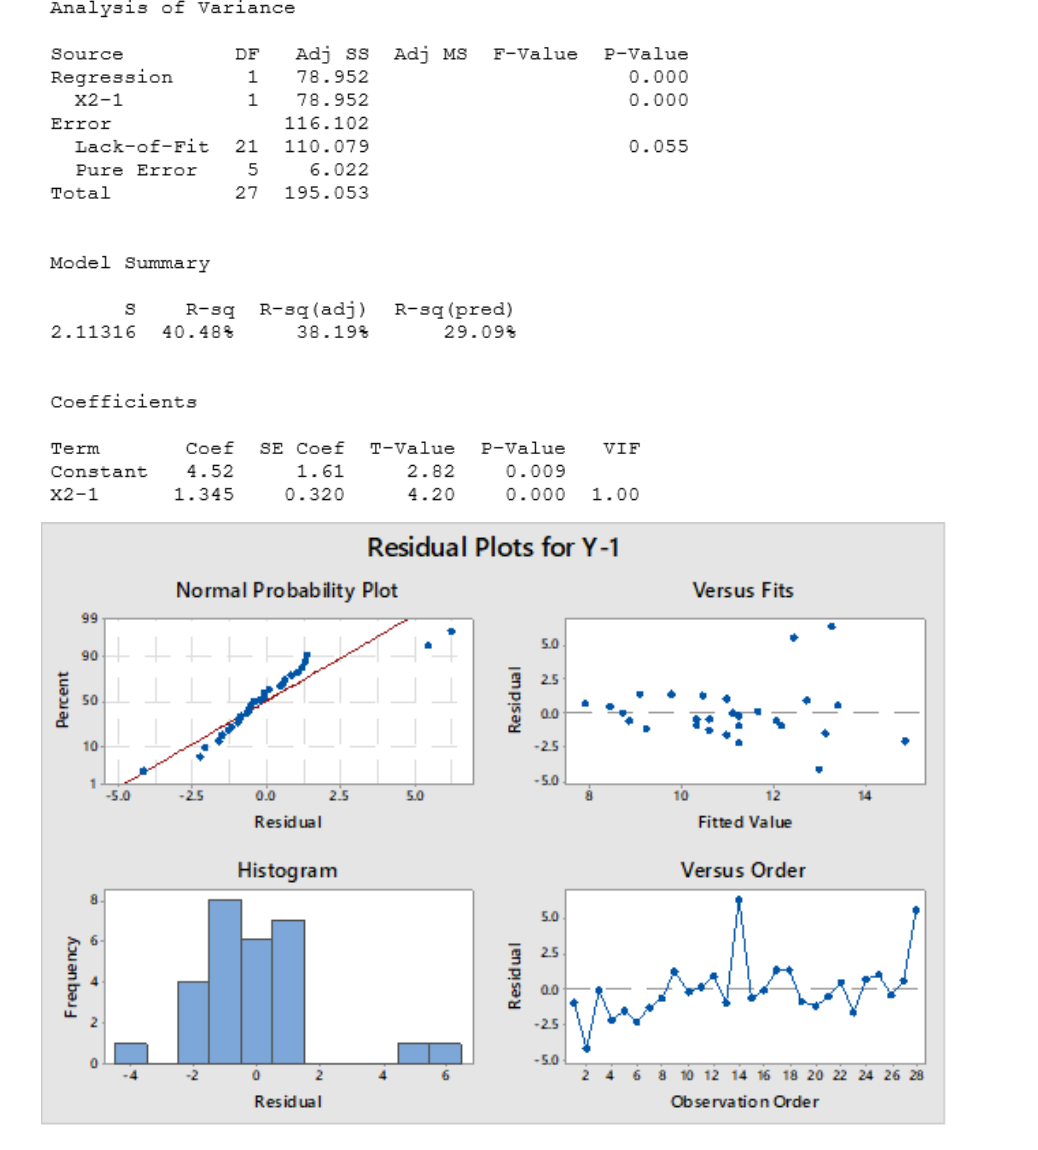
Regression analysis is conducted to associate variable X2-1 with the response variable Y-1. Portion of the Minitab results are shown below. Is the regression model adequate for the regression analysis? Justify. Identify the variance around the fitted values.
Regression analysis is conducted to associate variable X2-1 with the response variable Y-1. Portion of the Minitab results are shown below. Is the regression model adequate for the regression analysis? Justify. Identify the variance around the fitted values.

MATLAB: An Introduction with Applications
6th Edition
ISBN:9781119256830
Author:Amos Gilat
Publisher:Amos Gilat
Chapter1: Starting With Matlab
Section: Chapter Questions
Problem 1P

Related questions
Question
-
Regression analysis is conducted to associate variable X2-1 with the response variable Y-1. Portion of the Minitab results are shown below.-
Is the regression model adequate for the regression analysis? Justify.
-
Identify the variance around the fitted values.
-
Transcribed Image Text:Analysis of Variance
Source
Regression
X2-1
Error
Lack-of-Fit
Pure Error
Total
Model Summary
2.11316 40.48%
Coefficients
Term
Constant
X2-1
Percent
Frequency
99
90
S
50
10
1
-5.0
-4
R-sq R-sq (adj) R-sq (pred)
38.19%
29.09%
LIL
DF Adj SS Adj MS
1
1
78.952
78.952
116.102
21
110.079
5
6.022
27 195.053
Coef SE Coef
4.52
1.61
1.345
0.320
-2.5
-2
Normal Probability Plot
0.0
Residual
Histogram
0
2
2.5
Residual
T-Value
2.82
4.20
F-Value
5.0
6
Residual Plots for Y-1
P-Value
0.009
0.000 1.00
Residual
Residual
5.0
2.5
0.0
-2.5
-5.0
5.0
25
0.0
P-Value
0.000
0.000
-2.5
0.055
VIF
-5.0
10
2 4 6
Versus Fits
12
Fitted Value
Versus Order
المين مال ماست و
14
www
8
10 12 14 16 18 20 22 24 26 28
Observation Order
Expert Solution
This question has been solved!
Explore an expertly crafted, step-by-step solution for a thorough understanding of key concepts.

Step by step
Solved in 3 steps

Recommended textbooks for you
MATLAB: An Introduction with Applications
Statistics
ISBN:
9781119256830
Author:
Amos Gilat
Publisher:
John Wiley & Sons Inc

Probability and Statistics for Engineering and th…
Statistics
ISBN:
9781305251809
Author:
Jay L. Devore
Publisher:
Cengage Learning

Statistics for The Behavioral Sciences (MindTap C…
Statistics
ISBN:
9781305504912
Author:
Frederick J Gravetter, Larry B. Wallnau
Publisher:
Cengage Learning
MATLAB: An Introduction with Applications
Statistics
ISBN:
9781119256830
Author:
Amos Gilat
Publisher:
John Wiley & Sons Inc
Probability and Statistics for Engineering and th…
Statistics
ISBN:
9781305251809
Author:
Jay L. Devore
Publisher:
Cengage Learning
Statistics for The Behavioral Sciences (MindTap C…
Statistics
ISBN:
9781305504912
Author:
Frederick J Gravetter, Larry B. Wallnau
Publisher:
Cengage Learning

Elementary Statistics: Picturing the World (7th E…
Statistics
ISBN:
9780134683416
Author:
Ron Larson, Betsy Farber
Publisher:
PEARSON

The Basic Practice of Statistics
Statistics
ISBN:
9781319042578
Author:
David S. Moore, William I. Notz, Michael A. Fligner
Publisher:
W. H. Freeman

Introduction to the Practice of Statistics
Statistics
ISBN:
9781319013387
Author:
David S. Moore, George P. McCabe, Bruce A. Craig
Publisher:
W. H. Freeman