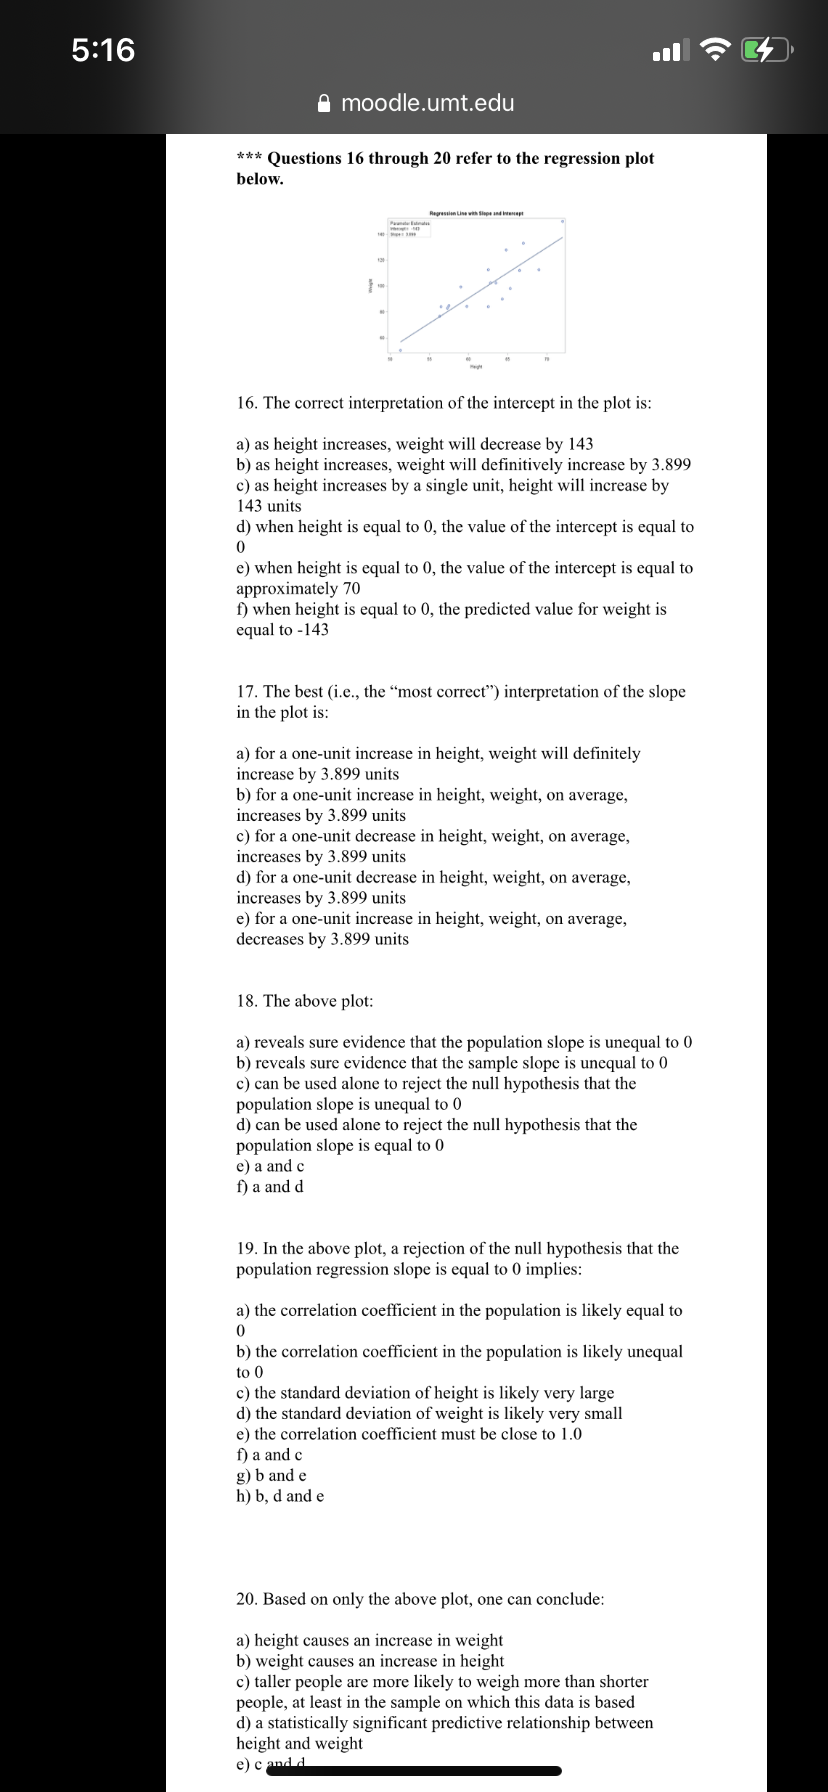
Regression Lise vth Siepe and eept Pne nal 16. The correct interpretation of the intercept in the plot is: a) as height increases, weight will decrease by 143 b) as height increases, weight will definitively increase by 3.899 c) as height inereases by a single unit, height will increase by 143 units d) when height is equal to 0, the value of the intercept is equal to e) when height is equal to 0, the value of the intercept is equal to approximately 70 f) when height is equal to 0, the predicted value for weight is equal to -143 17. The best (i.e., the “most correct") interpretation of the slope in the plot is: a) for a one-unit increase in height, weight will definitely increase by 3.899 units b) for a one-unit increase in height, weight, on average, increases by 3.899 units c) for a one-unit decrease in height, weight, on average, increases by 3.899 units d) for a one-unit decrease in height, weight, on average, increases by 3.899 units e) for a one-unit increase in height, weight, on average, decreases by 3.899 units 18. The above plot: a) reveals sure evidence that the population slope is unequal to 0 b) revcals sure evidence that the sample slope is unequal to 0 c) can be used alone to reject the null hypothesis that the population slope is unequal to 0 d) can be used alone to reject the null hypothesis that the population slope is equal to 0 e) a and e f) a and d

Mathematics For Machine Technology
8th Edition
ISBN:9781337798310
Author:Peterson, John.
Publisher:Peterson, John.
Chapter31: Customary Vernier Calipers And Height Gages
Section: Chapter Questions
Problem 16A: The tables for Exercises 15 and 16 give the position of the zero graduation on the vernier scale in...
icon
Related questions
icon
Concept explainers
Question
5:16
A moodle.umt.edu
*** Questions 16 through 20 refer to the regression plot
below.
Regression Lise vth ipe nd e
16. The correct interpretation of the intercept in the plot is:
a) as height increases, weight will decrease by 143
b) as height increases, weight will definitively increase by 3.899
c) as height increases by a single unit, height will increase by
143 units
d) when height is equal to 0, the value of the intercept is equal to
e) when height is equal to 0, the value of the intercept is equal to
approximately 70
f) when height is equal to 0, the predicted value for weight is
equal to -143
17. The best (i.e., the “most correct") interpretation of the slope
in the plot is:
a) for a one-unit increase in height, weight will definitely
increase by 3.899 units
b) for a one-unit increase in height, weight, on average,
increases by 3.899 units
c) for a one-unit decrease in height, weight, on average,
increases by 3.899 units
d) for a one-unit decrease in height, weight, on average,
increases by 3.899 units
e) for a one-unit increase in height, weight, on average,
decreases by 3.899 units
18. The above plot:
a) reveals sure evidence that the population slope is unequal to 0
b) reveals sure evidence that the sample slope is unequal to 0
c) can be used alone to reject the null hypothesis that the
population slope is unequal to 0
d) can be used alone to reject the null hypothesis that the
population slope is equal to 0
e) a and c
f) a and d
19. In the above plot, a rejection of the null hypothesis that the
population regression slope is equal to 0 implies:
a) the correlation coefficient in the population is likely equal to
b) the correlation coefficient in the population is likely unequal
to 0
c) the standard deviation of height is likely very large
d) the standard deviation of weight is likely very small
e) the correlation coefficient must be close to 1.0
f) a and c
g) b and e
h) b, d and e
20. Based on only the above plot, one can conclude:
a) height causes an increase in weight
b) weight causes an increase in height
c) taller people are more likely to weigh more than shorter
people, at least in the sample on which this data is based
d) a statistically significant predictive relationship between
height and weight
e) c and d
Transcribed Image Text:5:16 A moodle.umt.edu *** Questions 16 through 20 refer to the regression plot below. Regression Lise vth ipe nd e 16. The correct interpretation of the intercept in the plot is: a) as height increases, weight will decrease by 143 b) as height increases, weight will definitively increase by 3.899 c) as height increases by a single unit, height will increase by 143 units d) when height is equal to 0, the value of the intercept is equal to e) when height is equal to 0, the value of the intercept is equal to approximately 70 f) when height is equal to 0, the predicted value for weight is equal to -143 17. The best (i.e., the “most correct") interpretation of the slope in the plot is: a) for a one-unit increase in height, weight will definitely increase by 3.899 units b) for a one-unit increase in height, weight, on average, increases by 3.899 units c) for a one-unit decrease in height, weight, on average, increases by 3.899 units d) for a one-unit decrease in height, weight, on average, increases by 3.899 units e) for a one-unit increase in height, weight, on average, decreases by 3.899 units 18. The above plot: a) reveals sure evidence that the population slope is unequal to 0 b) reveals sure evidence that the sample slope is unequal to 0 c) can be used alone to reject the null hypothesis that the population slope is unequal to 0 d) can be used alone to reject the null hypothesis that the population slope is equal to 0 e) a and c f) a and d 19. In the above plot, a rejection of the null hypothesis that the population regression slope is equal to 0 implies: a) the correlation coefficient in the population is likely equal to b) the correlation coefficient in the population is likely unequal to 0 c) the standard deviation of height is likely very large d) the standard deviation of weight is likely very small e) the correlation coefficient must be close to 1.0 f) a and c g) b and e h) b, d and e 20. Based on only the above plot, one can conclude: a) height causes an increase in weight b) weight causes an increase in height c) taller people are more likely to weigh more than shorter people, at least in the sample on which this data is based d) a statistically significant predictive relationship between height and weight e) c and d
Expert Solution
trending now

Trending now

This is a popular solution!

steps

Step by step

Solved in 2 steps

Blurred answer
Knowledge Booster
Correlation, Regression, and Association
Learn more about
Need a deep-dive on the concept behind this application? Look no further. Learn more about this topic, statistics and related others by exploring similar questions and additional content below.
Similar questions
  • SEE MORE QUESTIONS
Recommended textbooks for you
Mathematics For Machine Technology
Advanced Math
ISBN:
9781337798310
Author:
Peterson, John.
Publisher:
Cengage Learning,
Algebra & Trigonometry with Analytic Geometry
Algebra
ISBN:
9781133382119
Author:
Swokowski
Publisher:
Cengage
Glencoe Algebra 1, Student Edition, 9780079039897…
Algebra
ISBN:
9780079039897
Author:
Carter
Publisher:
McGraw Hill