Remember that in Pisum sativum, yellow seed color is dominant over green, and smooth seed is dominant over constricted. In a dihybrid cross experiment, the following data was gathered: 189 green, smooth 178 yellow, constricted 564 yellow, smooth 69 green, constricted Are these genes assort independently based on the observed data? Support your answer using Chi-square test. Ans.
Remember that in Pisum sativum, yellow seed color is dominant over green, and smooth seed is dominant over constricted. In a dihybrid cross experiment, the following data was gathered: 189 green, smooth 178 yellow, constricted 564 yellow, smooth 69 green, constricted Are these genes assort independently based on the observed data? Support your answer using Chi-square test. Ans.

A First Course in Probability (10th Edition)
10th Edition
ISBN:9780134753119
Author:Sheldon Ross
Publisher:Sheldon Ross
Chapter1: Combinatorial Analysis
Section: Chapter Questions
Problem 1.1P: a. How many different 7-place license plates are possible if the first 2 places are for letters and...

Related questions
Question
100%
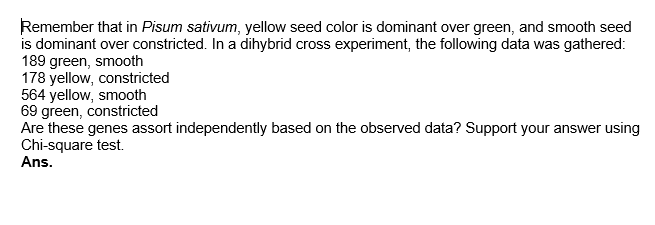
Transcribed Image Text:Remember that in Pisum sativum, yellow seed color is dominant over green, and smooth seed
is dominant over constricted. In a dihybrid cross experiment, the following data was gathered:
189 green, smooth
178 yellow, constricted
564 yellow, smooth
69 green, constricted
Are these genes assort independently based on the observed data? Support your answer using
Chi-square test.
Ans.
Expert Solution
This question has been solved!
Explore an expertly crafted, step-by-step solution for a thorough understanding of key concepts.

Step by step
Solved in 4 steps with 4 images

Recommended textbooks for you
A First Course in Probability (10th Edition)
Probability
ISBN:
9780134753119
Author:
Sheldon Ross
Publisher:
PEARSON

A First Course in Probability (10th Edition)
Probability
ISBN:
9780134753119
Author:
Sheldon Ross
Publisher:
PEARSON