Restaurant Drive-Through Service Times Service Times (seconds) Restaurant X 122 110 110 Restaurant Y 80 181 335 144 04 158 202 103 303 107 157 143 180 118 233 230 118 145 104 183 157 140 270 207 158 181 68 178 357 101 187 305 97 134 135 123 148 148 248 232 248 235 238 187 78 148 127 150 108 137 02 108 157 113 128 217 242 140 173 170 122 205 130 140 121 220 134 300 176 184 177 113 195 220 200 107 144 141 131 140 108 148 162 85 145 127 105 141 180 55 100 153 175 122 122 174 110


Correlation
Correlation defines a relationship between two independent variables. It tells the degree to which variables move in relation to each other. When two sets of data are related to each other, there is a correlation between them.
Linear Correlation
A correlation is used to determine the relationships between numerical and categorical variables. In other words, it is an indicator of how things are connected to one another. The correlation analysis is the study of how variables are related.
Regression Analysis
Regression analysis is a statistical method in which it estimates the relationship between a dependent variable and one or more independent variable. In simple terms dependent variable is called as outcome variable and independent variable is called as predictors. Regression analysis is one of the methods to find the trends in data. The independent variable used in Regression analysis is named Predictor variable. It offers data of an associated dependent variable regarding a particular outcome.
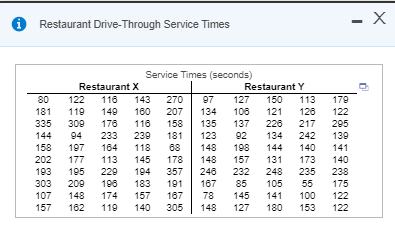
Refer to the accompanying data set of
A. Construct a 95% confidence interval of the mean drive-through service times at dinner for Restaurant X.
B. Construct a 95% confidence interval of the mean drive-through service times at dinner for Restaurant Y.
____<μ<___sec


Trending now
This is a popular solution!

Step by step
Solved in 6 steps with 7 images


