Results of Regressions of Average Houry Earning Education Binary Variables and Other Characteristics Using Data from the Current Population Survey Dependent variable: average hourly earnings (AHE). Regressor (1) (2) (3) 5.57 5.59 5.55 College (X,) Female (X2) -2.69 -2.67 -2.67 0.30 0.30 Age (X) 0.70 Northeast (X,) 0.61 Midwest (Xs) South (X) -0.28 12.94 4.49 3.83 Intercept Summary Statistics SER 6.40 6.34 6.33 0.180 0.194 0.198 0.180 0.193 O 97 4100 4100 4100 Using the regression results in column (2) On average, a worker eams $ per hour V for each year that he or she ages.
Results of Regressions of Average Houry Earning Education Binary Variables and Other Characteristics Using Data from the Current Population Survey Dependent variable: average hourly earnings (AHE). Regressor (1) (2) (3) 5.57 5.59 5.55 College (X,) Female (X2) -2.69 -2.67 -2.67 0.30 0.30 Age (X) 0.70 Northeast (X,) 0.61 Midwest (Xs) South (X) -0.28 12.94 4.49 3.83 Intercept Summary Statistics SER 6.40 6.34 6.33 0.180 0.194 0.198 0.180 0.193 O 97 4100 4100 4100 Using the regression results in column (2) On average, a worker eams $ per hour V for each year that he or she ages.

Managerial Economics: Applications, Strategies and Tactics (MindTap Course List)
14th Edition
ISBN:9781305506381
Author:James R. McGuigan, R. Charles Moyer, Frederick H.deB. Harris
Publisher:James R. McGuigan, R. Charles Moyer, Frederick H.deB. Harris
Chapter7: Production Economics
Section: Chapter Questions
Problem 1.3CE

Related questions
Question
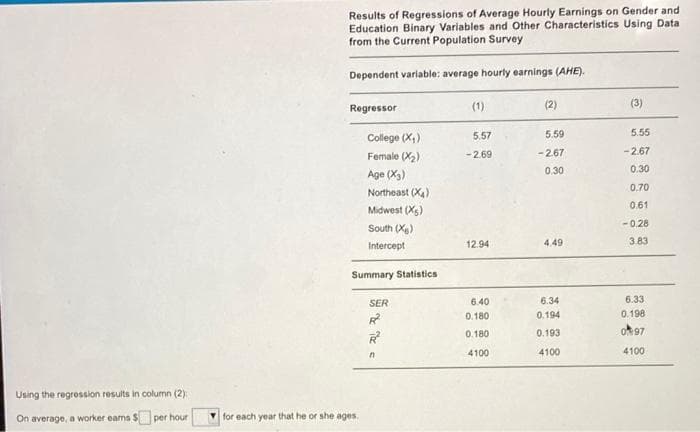
Transcribed Image Text:Results of Regressions of Average Hourly Earnings on Gender and
Education Binary Variables and Other Characteristics Using Data
from the Current Population Survey
Dependent variable: average hourly earnings (AHE).
Regressor
(1)
(2)
(3)
5.59
5.55
College (X,)
5.57
Female (X2)
-2.69
-2.67
-2.67
0.30
0.30
Age (X3)
0.70
Northeast (X4)
0.61
Midwest (Xs)
-0.28
South (X)
Intercept
12.94
4.49
3.83
Summary Statistics
SER
6.40
6.34
6.33
0.180
0.194
0.198
0.193
ok97
0.180
4100
4100
4100
Using the regression results in column (2):
On average, a worker eans $ per hour
for each year that he or she ages.
Expert Solution
This question has been solved!
Explore an expertly crafted, step-by-step solution for a thorough understanding of key concepts.

This is a popular solution!

Trending now
This is a popular solution!

Step by step
Solved in 2 steps

Recommended textbooks for you
Managerial Economics: Applications, Strategies an…
Economics
ISBN:
9781305506381
Author:
James R. McGuigan, R. Charles Moyer, Frederick H.deB. Harris
Publisher:
Cengage Learning
Managerial Economics: Applications, Strategies an…
Economics
ISBN:
9781305506381
Author:
James R. McGuigan, R. Charles Moyer, Frederick H.deB. Harris
Publisher:
Cengage Learning