Round your answers to three decimal places. The students are interested in using the width of the beans to predict the height. Calculate the slope of the regression equation. Write the equation of the line of best fit that can be used to predict bean heights. Use a to represent width and y to represent height. What fraction of the variability in bean heights can be explained by the linear model of bean height vs. width? Express your answer as a decimal.
Round your answers to three decimal places. The students are interested in using the width of the beans to predict the height. Calculate the slope of the regression equation. Write the equation of the line of best fit that can be used to predict bean heights. Use a to represent width and y to represent height. What fraction of the variability in bean heights can be explained by the linear model of bean height vs. width? Express your answer as a decimal.

Algebra & Trigonometry with Analytic Geometry
13th Edition
ISBN:9781133382119
Author:Swokowski
Publisher:Swokowski
Chapter7: Analytic Trigonometry
Section7.2: Trigonometric Equations
Problem 100E

Related questions
Question
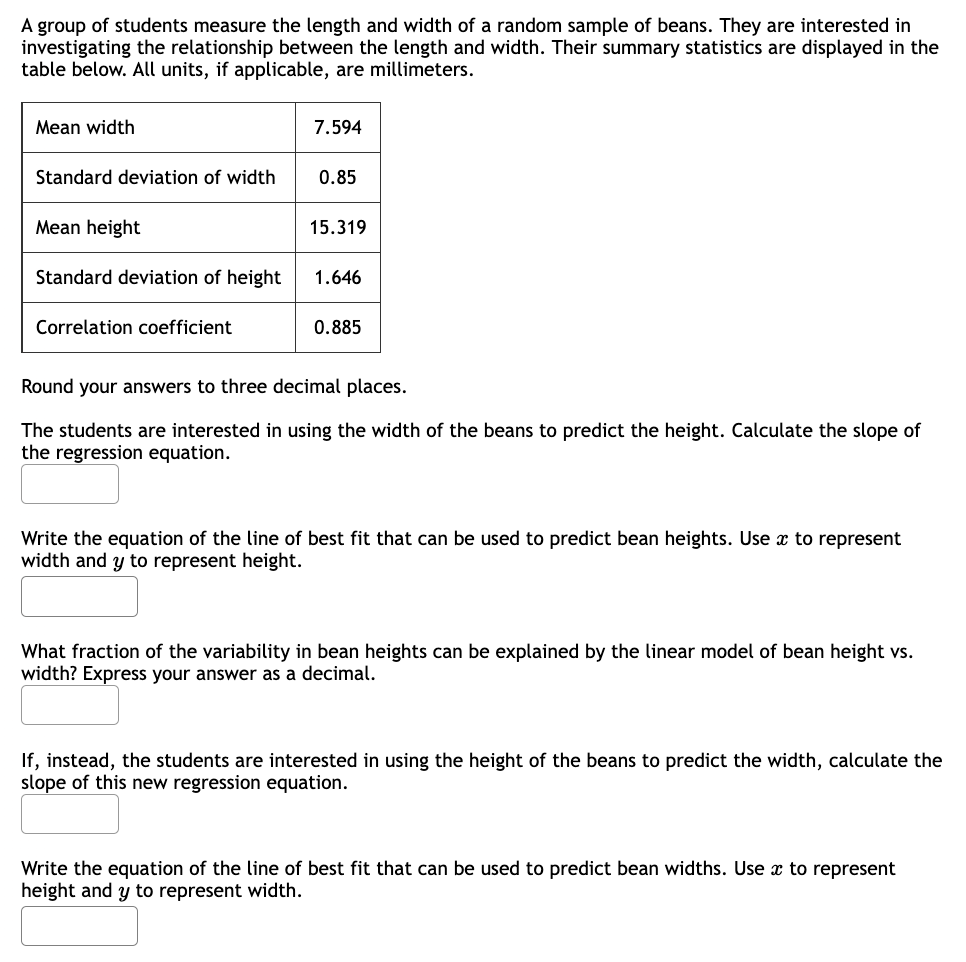
Transcribed Image Text:A group of students measure the length and width of a random sample of beans. They are interested in
investigating the relationship between the length and width. Their summary statistics are displayed in the
table below. All units, if applicable, are millimeters.
Mean width
Standard deviation of width
Mean height
Standard deviation of height
Correlation coefficient
7.594
0.85
15.319
1.646
0.885
Round your answers to three decimal places.
The students are interested in using the width of the beans to predict the height. Calculate the slope of
the regression equation.
Write the equation of the line of best fit that can be used to predict bean heights. Use x to represent
width and y to represent height.
What fraction of the variability in bean heights can be explained by the linear model of bean height vs.
width? Express your answer as a decimal.
If, instead, the students are interested in using the height of the beans to predict the width, calculate the
slope of this new regression equation.
Write the equation of the line of best fit that can be used to predict bean widths. Use a to represent
height and y to represent width.
Expert Solution
This question has been solved!
Explore an expertly crafted, step-by-step solution for a thorough understanding of key concepts.

Step by step
Solved in 4 steps

Recommended textbooks for you
Algebra & Trigonometry with Analytic Geometry
Algebra
ISBN:
9781133382119
Author:
Swokowski
Publisher:
Cengage
Algebra & Trigonometry with Analytic Geometry
Algebra
ISBN:
9781133382119
Author:
Swokowski
Publisher:
Cengage