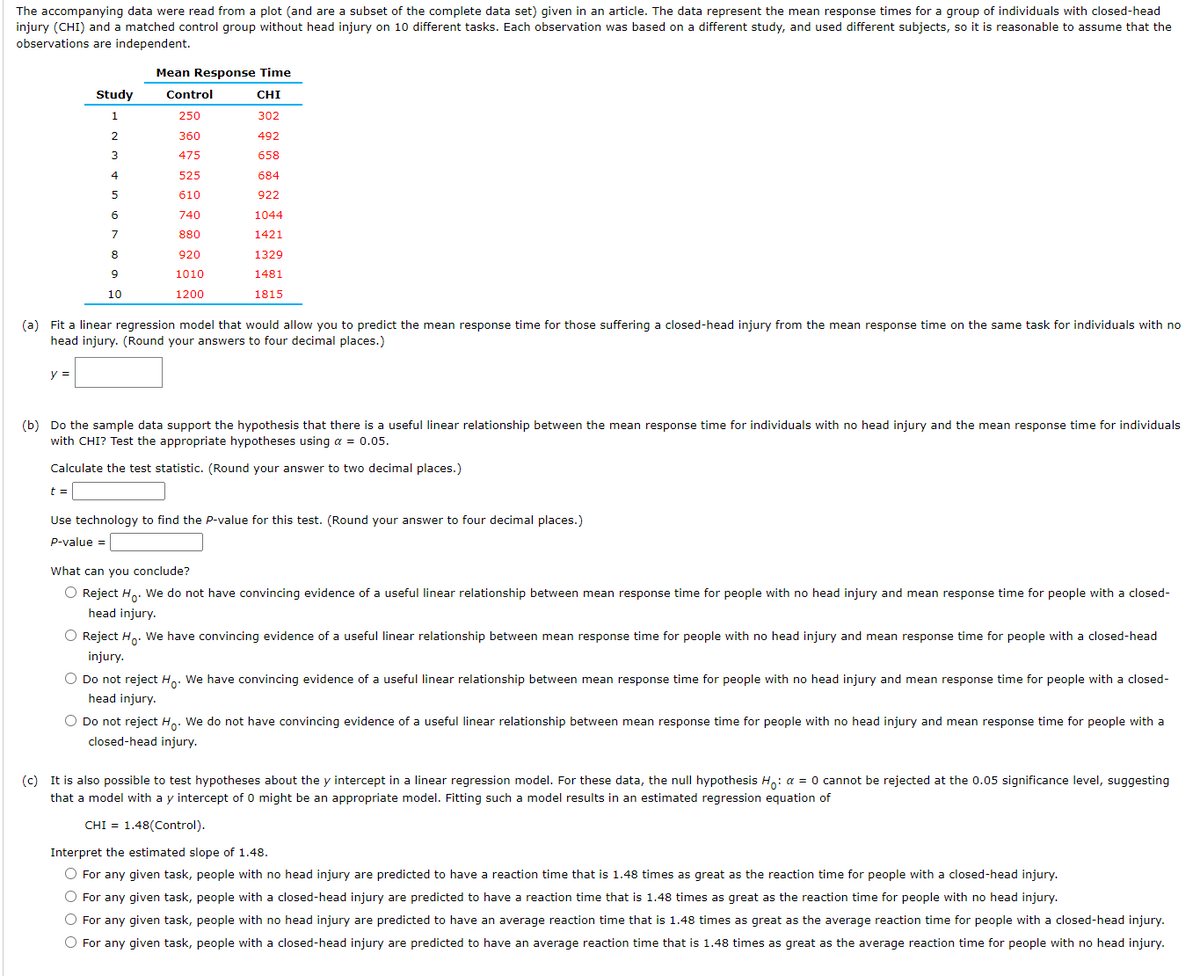
The accompanying data were read from a plot (and are a subset of the complete data set) given in an article. The data represent the mean response times for a group of individuals with closed-head injury (CHI) and a matched control group without head injury on 10 different tasks. Each observation was based on a different study, and used different subjects, so it is reasonable to assume that the observations are independent. Study 1 2 3 4 5 6 7 8 9 10 y = Mean Response Time CHI 302 492 658 684 922 1044 1421 1329 1481 1815 Control 250 360 475 525 610 740 880 920 1010 1200 (a) Fit a linear regression model that would allow you to predict the mean response time for those suffering a closed-head injury from the mean response time on the same task for individuals with no head injury. (Round your answers to four decimal places.) (b) Do the sample data support the hypothesis that there is a useful linear relationship between the mean response time for individuals with no head injury and the mean response time for individuals with CHI? Test the appropriate hypotheses using a = 0.05. Calculate the test statistic. (Round your answer to two decimal places.) t= Use technology to find the P-value for this test. (Round your answer to four decimal places.) P-value= What can you conclude? O Reject Ho. We do not have convincing evidence of a useful linear relationship between mean response time for people with no head injury and mean response time for people with a closed- head injury. O Reject Ho. We have convincing evidence of a useful linear relationship between mean response time for people with no head injury and mean response time for people with a closed-head injury. O Do not reject H. We have convincing evidence of a useful linear relationship between mean response time for people with no head injury and mean response time for people with a closed- head injury. O Do not reject Ho. We do not have convincing evidence of a useful linear relationship between mean response time for people with no head injury and mean response time for people with a closed-head injury. (c) It is also possible to test hypotheses about the y intercept in a linear regression model. For these data, the null hypothesis Ho: a = 0 cannot be rejected at the 0.05 significance level, suggesting that a model with a y intercept of 0 might be an appropriate model. Fitting such a model results in an estimated regression equation of CHI 1.48(Control). Interpret the estimated slope of 1.48. O For any given task, people with no head injury are predicted to have a reaction time that is 1.48 times as great as the reaction time for people with a closed-head injury. O For any given task, people with a closed-head injury are predicted to have a reaction time that is 1.48 times as great as the reaction time for people with no head injury. O For any given task, people with no head injury are predicted to have an average reaction time that is 1.48 times as great as the average reaction time for people with a closed-head injury. O For any given task, people with a closed-head injury are predicted to have an average reaction time that is 1.48 times as great as the average reaction time for people with no head injury.
The accompanying data were read from a plot (and are a subset of the complete data set) given in an article. The data represent the mean response times for a group of individuals with closed-head injury (CHI) and a matched control group without head injury on 10 different tasks. Each observation was based on a different study, and used different subjects, so it is reasonable to assume that the observations are independent. Study 1 2 3 4 5 6 7 8 9 10 y = Mean Response Time CHI 302 492 658 684 922 1044 1421 1329 1481 1815 Control 250 360 475 525 610 740 880 920 1010 1200 (a) Fit a linear regression model that would allow you to predict the mean response time for those suffering a closed-head injury from the mean response time on the same task for individuals with no head injury. (Round your answers to four decimal places.) (b) Do the sample data support the hypothesis that there is a useful linear relationship between the mean response time for individuals with no head injury and the mean response time for individuals with CHI? Test the appropriate hypotheses using a = 0.05. Calculate the test statistic. (Round your answer to two decimal places.) t= Use technology to find the P-value for this test. (Round your answer to four decimal places.) P-value= What can you conclude? O Reject Ho. We do not have convincing evidence of a useful linear relationship between mean response time for people with no head injury and mean response time for people with a closed- head injury. O Reject Ho. We have convincing evidence of a useful linear relationship between mean response time for people with no head injury and mean response time for people with a closed-head injury. O Do not reject H. We have convincing evidence of a useful linear relationship between mean response time for people with no head injury and mean response time for people with a closed- head injury. O Do not reject Ho. We do not have convincing evidence of a useful linear relationship between mean response time for people with no head injury and mean response time for people with a closed-head injury. (c) It is also possible to test hypotheses about the y intercept in a linear regression model. For these data, the null hypothesis Ho: a = 0 cannot be rejected at the 0.05 significance level, suggesting that a model with a y intercept of 0 might be an appropriate model. Fitting such a model results in an estimated regression equation of CHI 1.48(Control). Interpret the estimated slope of 1.48. O For any given task, people with no head injury are predicted to have a reaction time that is 1.48 times as great as the reaction time for people with a closed-head injury. O For any given task, people with a closed-head injury are predicted to have a reaction time that is 1.48 times as great as the reaction time for people with no head injury. O For any given task, people with no head injury are predicted to have an average reaction time that is 1.48 times as great as the average reaction time for people with a closed-head injury. O For any given task, people with a closed-head injury are predicted to have an average reaction time that is 1.48 times as great as the average reaction time for people with no head injury.

Glencoe Algebra 1, Student Edition, 9780079039897, 0079039898, 2018
18th Edition
ISBN:9780079039897
Author:Carter
Publisher:Carter
Chapter10: Statistics
Section10.5: Comparing Sets Of Data
Problem 13PPS

Related questions
Question
Transcribed Image Text:The accompanying data were read from a plot (and are a subset of the complete data set) given in an article. The data represent the mean response times for a group of individuals with closed-head
injury (CHI) and a matched control group without head injury on 10 different tasks. Each observation was based on a different study, and used different subjects, so it is reasonable to assume that the
observations are independent.
y =
Study
1
2
3
4
5
6
7
8
9
10
Mean Response Time
CHI
302
492
658
684
922
1044
1421
1329
1481
1815
t =
Control
250
360
475
(a) Fit a linear regression model that would allow you to predict the mean response time for those suffering a closed-head injury from the mean response time on the same task for individuals with no
head injury. (Round your answers to four decimal places.)
525
610
740
880
920
1010
1200
(b) Do the sample data support the hypothesis that there is a useful linear relationship between the mean response time for individuals with no head injury and the mean response time for individuals
with CHI? Test the appropriate hypotheses using a = 0.05.
Calculate the test statistic. (Round your answer to two decimal places.)
Use technology to find the P-value for this test. (Round your answer to four decimal places.)
P-value =
What can you conclude?
O Reject Ho. We do not have convincing evidence of a useful linear relationship between mean response time for people with no head injury and mean response time for people with a closed-
head injury.
O Reject Ho. We have convincing evidence of a useful linear relationship between mean response time for people with no head injury and mean response time for people with a closed-head
injury.
O Do not reject Ho. We have convincing evidence of a useful linear relationship between mean response time for people with no head injury and mean response time for people with a closed-
head injury.
O Do not reject Ho. We do not have convincing evidence of a useful linear relationship between mean response time for people with no head injury and mean response time for people with a
closed-head injury.
(c) It is also possible to test hypotheses about the y intercept in a linear regression model. For these data, the null hypothesis Ho: a = 0 cannot be rejected at the 0.05 significance level, suggesting
that a model with a y intercept of 0 might be an appropriate model. Fitting such a model results in an estimated regression equation of
CHI 1.48(Control).
Interpret the estimated slope of 1.48.
O For any given task, people with no head injury are predicted to have a reaction time that is 1.48 times as great as the reaction time for people with a closed-head injury.
O For any given task, people with a closed-head injury are predicted to have a reaction time that is 1.48 times as great as the reaction time for people with no head injury.
O For any given task, people with no head injury are predicted to have an average reaction time that is 1.48 times as great as the average reaction time for people with a closed-head injury.
O For any given task, people with a closed-head injury are predicted to have an average reaction time that is 1.48 times as great as the average reaction time for people with no head injury.
Expert Solution
This question has been solved!
Explore an expertly crafted, step-by-step solution for a thorough understanding of key concepts.

This is a popular solution!

Trending now
This is a popular solution!

Step by step
Solved in 4 steps with 1 images

Recommended textbooks for you
Glencoe Algebra 1, Student Edition, 9780079039897…
Algebra
ISBN:
9780079039897
Author:
Carter
Publisher:
McGraw Hill
Glencoe Algebra 1, Student Edition, 9780079039897…
Algebra
ISBN:
9780079039897
Author:
Carter
Publisher:
McGraw Hill