Run a regression analysis on the following data set, where y is the final grade in a math class and x is the average number of hours the student spent working on math each week hours/week Grade X У 53.6 5 47 8 66.2 9 68.6 11 78.4 12 72.8 14 83.6 15 93 19 100 19 100 State the regression equation y = m x + b, with constants accurate to two decimal places. Preview * What is the predicted value for the final grade when a student spends an average of 10 hours each week on math? * Round to 1 decimal place Grade Get help: Video Video The following table shows retail sales in drug stores in billions of dollars in the U.S for years since 1995 Year Retail Sales 0 85.851 3 108.426 6 141.781 9 169.256 12 202.297 15 222.266 Let S(t) be the retails sales in billions of dollars in t years since 1995. A linear model for the data is F(t) = 9.44t + 84.182 220 210 200 190 180 170 160 150 140 130 120 110 100 90 6 12 80 Use the above scatter plot to decide whether the linear model fits the data well The function is a good model for the data. OThe function is not a good model for the data |x billions of dollars Estimate the retails sales in the U. S. in 2017. Use the model to predict the year that corresponds to retails sales of $248 billion. Hint: Help
Run a regression analysis on the following data set, where y is the final grade in a math class and x is the average number of hours the student spent working on math each week hours/week Grade X У 53.6 5 47 8 66.2 9 68.6 11 78.4 12 72.8 14 83.6 15 93 19 100 19 100 State the regression equation y = m x + b, with constants accurate to two decimal places. Preview * What is the predicted value for the final grade when a student spends an average of 10 hours each week on math? * Round to 1 decimal place Grade Get help: Video Video The following table shows retail sales in drug stores in billions of dollars in the U.S for years since 1995 Year Retail Sales 0 85.851 3 108.426 6 141.781 9 169.256 12 202.297 15 222.266 Let S(t) be the retails sales in billions of dollars in t years since 1995. A linear model for the data is F(t) = 9.44t + 84.182 220 210 200 190 180 170 160 150 140 130 120 110 100 90 6 12 80 Use the above scatter plot to decide whether the linear model fits the data well The function is a good model for the data. OThe function is not a good model for the data |x billions of dollars Estimate the retails sales in the U. S. in 2017. Use the model to predict the year that corresponds to retails sales of $248 billion. Hint: Help

Glencoe Algebra 1, Student Edition, 9780079039897, 0079039898, 2018
18th Edition
ISBN:9780079039897
Author:Carter
Publisher:Carter
Chapter4: Equations Of Linear Functions
Section4.6: Regression And Median-fit Lines
Problem 6PPS

Related questions
Question
I need help finding the answer on the TI84 Plus CE and on paper ?. Thank you
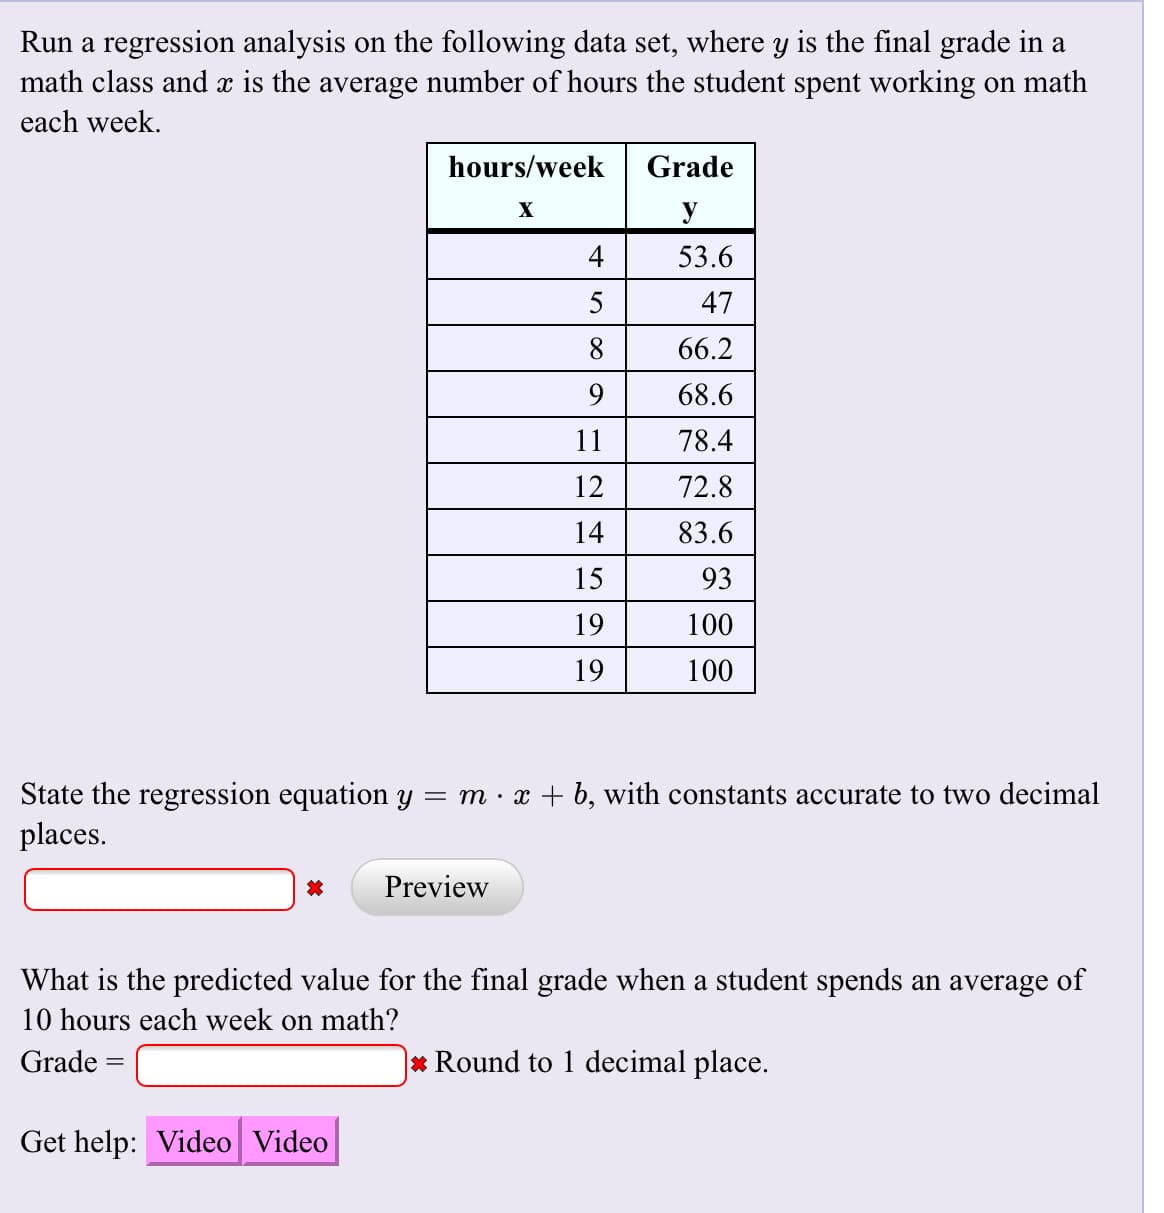
Transcribed Image Text:Run a regression analysis on the following data set, where y is the final grade in a
math class and x is the average number of hours the student spent working on math
each week
hours/week
Grade
X
У
53.6
5
47
8
66.2
9
68.6
11
78.4
12
72.8
14
83.6
15
93
19
100
19
100
State the regression equation y = m x + b, with constants accurate to two decimal
places.
Preview
*
What is the predicted value for the final grade when a student spends an average of
10 hours each week on math?
* Round to 1 decimal place
Grade
Get help: Video Video
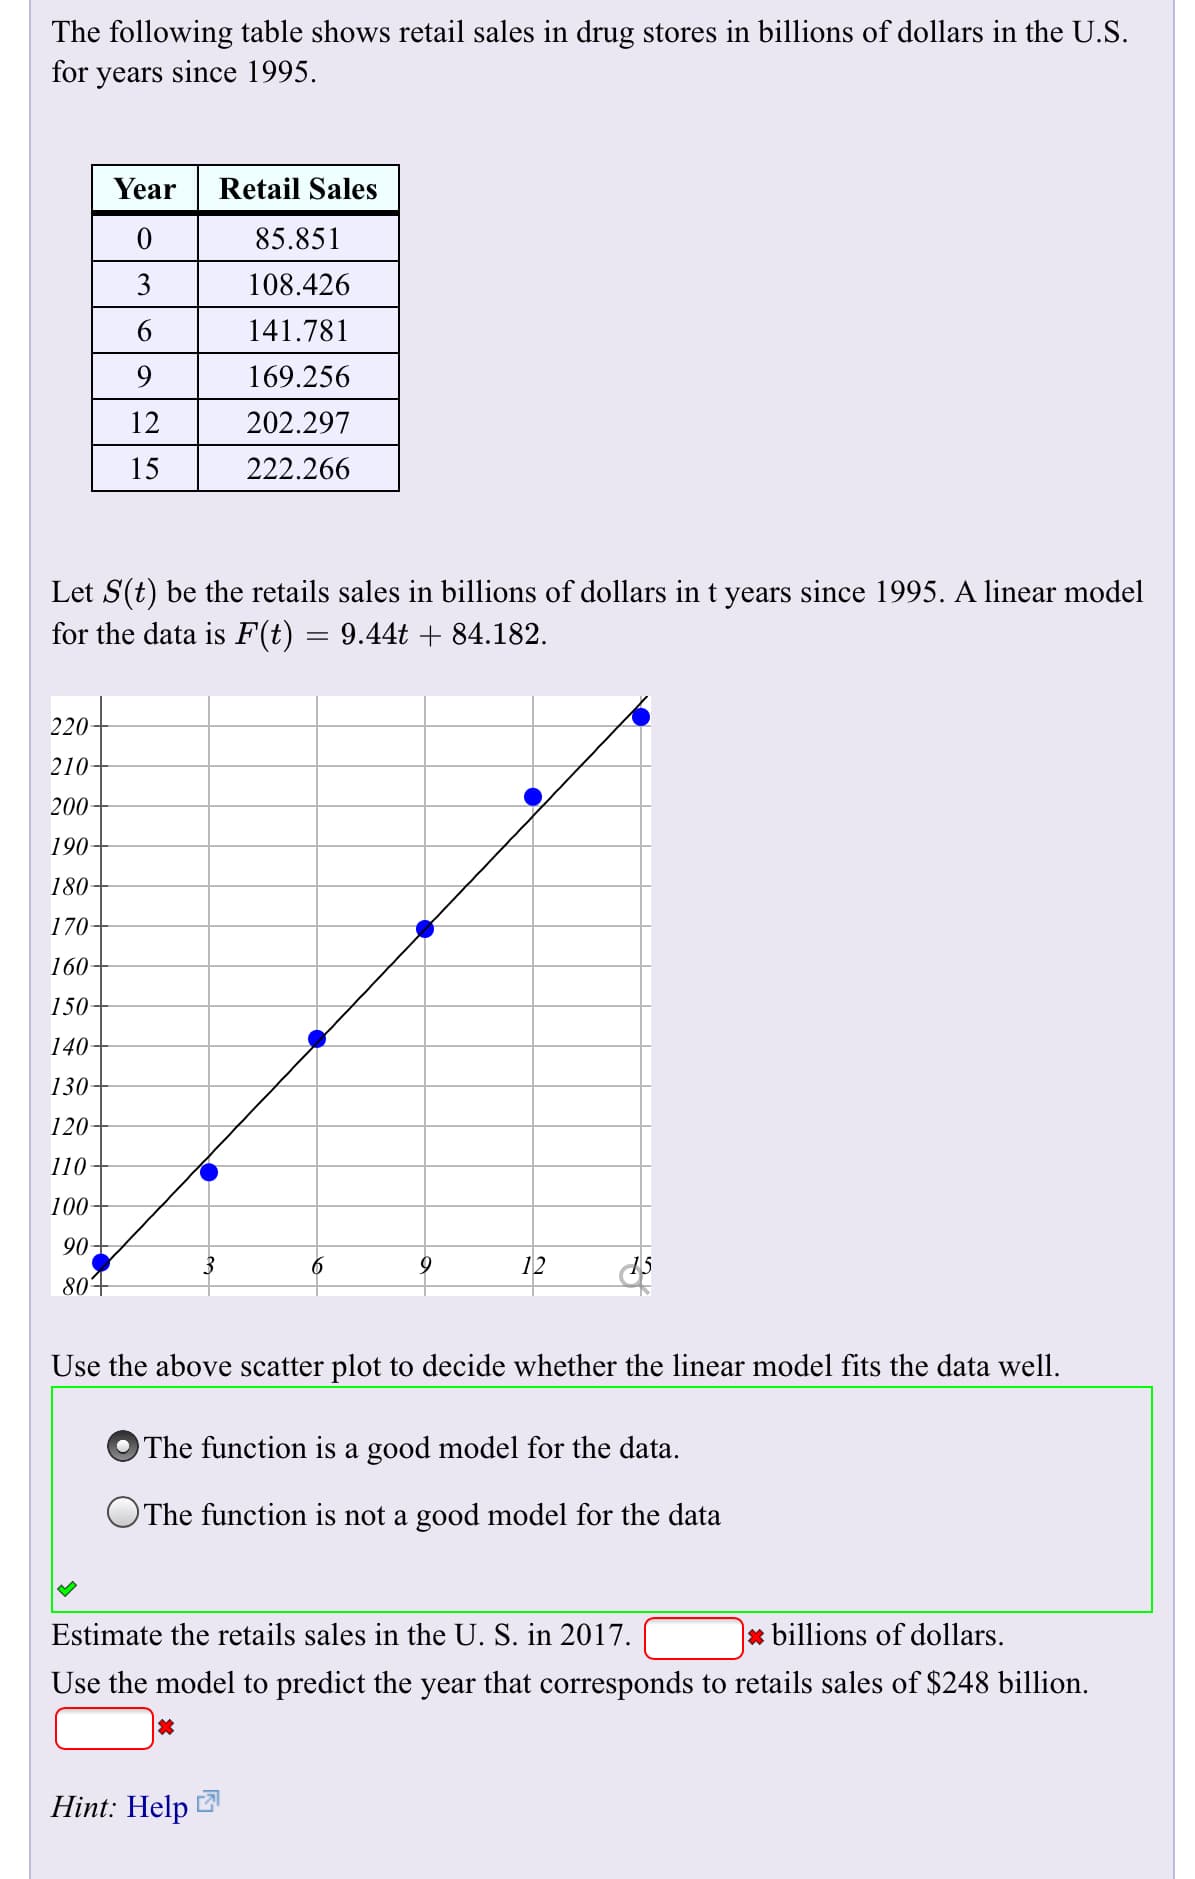
Transcribed Image Text:The following table shows retail sales in drug stores in billions of dollars in the U.S
for years since 1995
Year
Retail Sales
0
85.851
3
108.426
6
141.781
9
169.256
12
202.297
15
222.266
Let S(t) be the retails sales in billions of dollars in t years since 1995. A linear model
for the data is F(t) = 9.44t + 84.182
220
210
200
190
180
170
160
150
140
130
120
110
100
90
6
12
80
Use the above scatter plot to decide whether the linear model fits the data well
The function is a good model for the data.
OThe function is not a good model for the data
|x billions of dollars
Estimate the retails sales in the U. S. in 2017.
Use the model to predict the year that corresponds to retails sales of $248 billion.
Hint: Help
Expert Solution
This question has been solved!
Explore an expertly crafted, step-by-step solution for a thorough understanding of key concepts.

This is a popular solution!

Trending now
This is a popular solution!

Step by step
Solved in 2 steps with 1 images

Knowledge Booster


Learn more about
Need a deep-dive on the concept behind this application? Look no further. Learn more about this topic, statistics and related others by exploring similar questions and additional content below.Recommended textbooks for you
Glencoe Algebra 1, Student Edition, 9780079039897…
Algebra
ISBN:
9780079039897
Author:
Carter
Publisher:
McGraw Hill

Algebra & Trigonometry with Analytic Geometry
Algebra
ISBN:
9781133382119
Author:
Swokowski
Publisher:
Cengage

Functions and Change: A Modeling Approach to Coll…
Algebra
ISBN:
9781337111348
Author:
Bruce Crauder, Benny Evans, Alan Noell
Publisher:
Cengage Learning
Glencoe Algebra 1, Student Edition, 9780079039897…
Algebra
ISBN:
9780079039897
Author:
Carter
Publisher:
McGraw Hill
Algebra & Trigonometry with Analytic Geometry
Algebra
ISBN:
9781133382119
Author:
Swokowski
Publisher:
Cengage
Functions and Change: A Modeling Approach to Coll…
Algebra
ISBN:
9781337111348
Author:
Bruce Crauder, Benny Evans, Alan Noell
Publisher:
Cengage Learning

Big Ideas Math A Bridge To Success Algebra 1: Stu…
Algebra
ISBN:
9781680331141
Author:
HOUGHTON MIFFLIN HARCOURT
Publisher:
Houghton Mifflin Harcourt