Sales Month (000 units) Feb. Mar. Apr. May Jun. Jul. Aug. 19 18 15 20 18 22 20 a. Plot the monthly data on a sheet of graph paper. b. Forecast September sales volume using each of the following: (1) The naive approach (2) A five-month moving average (3) A weighted average using .60 for August, .30 for July, and .10 for June (4) Exponential smoothing with a smoothing constant equal to .20, assuming a a March forecast of 19(000) (5) A linear trend equation c. Which method seems least appropriate? Why? (Hint: Refer to your plot from part a.) d. What does use of the term sales rather than demand presume?
Sales Month (000 units) Feb. Mar. Apr. May Jun. Jul. Aug. 19 18 15 20 18 22 20 a. Plot the monthly data on a sheet of graph paper. b. Forecast September sales volume using each of the following: (1) The naive approach (2) A five-month moving average (3) A weighted average using .60 for August, .30 for July, and .10 for June (4) Exponential smoothing with a smoothing constant equal to .20, assuming a a March forecast of 19(000) (5) A linear trend equation c. Which method seems least appropriate? Why? (Hint: Refer to your plot from part a.) d. What does use of the term sales rather than demand presume?

Managerial Economics: Applications, Strategies and Tactics (MindTap Course List)
14th Edition
ISBN:9781305506381
Author:James R. McGuigan, R. Charles Moyer, Frederick H.deB. Harris
Publisher:James R. McGuigan, R. Charles Moyer, Frederick H.deB. Harris
Chapter5: Business And Economic Forecasting
Section: Chapter Questions
Problem 5E: A firm experienced the demand shown in the following table. *Unkown future value to be forecast Fill...

Related questions
Question
If excel work required then attached screenshot
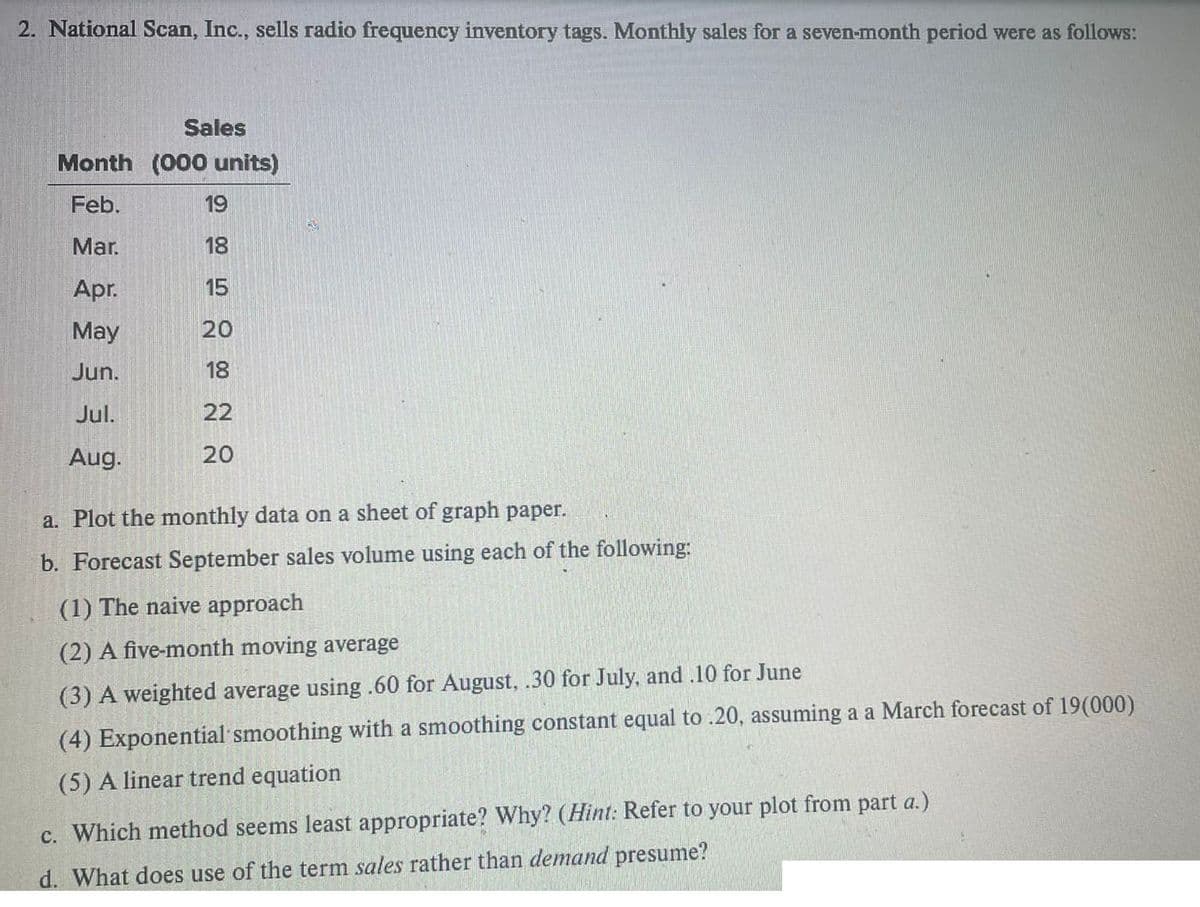
Transcribed Image Text:2. National Scan, Inc., sells radio frequency inventory tags. Monthly sales for a seven-month period were as follows:
Sales
Month (000 units)
Feb.
Mar.
Apr.
May
Jun.
Jul.
Aug.
19
18
15
20
18
22
20
a. Plot the monthly data on a sheet of graph paper.
b. Forecast September sales volume using each of the following:
(1) The naive approach
(2) A five-month moving average
(3) A weighted average using .60 for August, .30 for July, and .10 for June
(4) Exponential smoothing with a smoothing constant equal to .20, assuming a a March forecast of 19(000)
(5) A linear trend equation
c. Which method seems least appropriate? Why? (Hint: Refer to your plot from part a.)
d. What does use of the term sales rather than demand presume?
Expert Solution
This question has been solved!
Explore an expertly crafted, step-by-step solution for a thorough understanding of key concepts.

Step by step
Solved in 5 steps with 5 images

Knowledge Booster


Learn more about
Need a deep-dive on the concept behind this application? Look no further. Learn more about this topic, economics and related others by exploring similar questions and additional content below.Recommended textbooks for you
Managerial Economics: Applications, Strategies an…
Economics
ISBN:
9781305506381
Author:
James R. McGuigan, R. Charles Moyer, Frederick H.deB. Harris
Publisher:
Cengage Learning
Managerial Economics: Applications, Strategies an…
Economics
ISBN:
9781305506381
Author:
James R. McGuigan, R. Charles Moyer, Frederick H.deB. Harris
Publisher:
Cengage Learning