Consider the equations and graphs for the demand and supply functions given below, then answer the following questions. P = 5Q²+72Q (Eq. 1) P = -Q²-3Q+2023 (Eq. 2) Note: P is in dollars and cents and Q is in units Maximum Volve for Curve B CUNE A (e) Curve A passes through the origin. Explain why this is usually the case. Curve B Note: Curve A is Demand and Curve B is Supply (d) The maximum point for curve B is shown in the diagram in the left of the vertical axis. Explain why this should be the case. (f) Calculate the equilibrium quantity and price. (Answer to 2 decimal places) Note that equilibrium occurs when the quantity demanded = quantity supplied
Consider the equations and graphs for the demand and supply functions given below, then answer the following questions. P = 5Q²+72Q (Eq. 1) P = -Q²-3Q+2023 (Eq. 2) Note: P is in dollars and cents and Q is in units Maximum Volve for Curve B CUNE A (e) Curve A passes through the origin. Explain why this is usually the case. Curve B Note: Curve A is Demand and Curve B is Supply (d) The maximum point for curve B is shown in the diagram in the left of the vertical axis. Explain why this should be the case. (f) Calculate the equilibrium quantity and price. (Answer to 2 decimal places) Note that equilibrium occurs when the quantity demanded = quantity supplied

Chapter4: Demand, Supply, And Market Equilibrium
Section: Chapter Questions
Problem 25P

Related questions
Question
Please help and provide concise solution. Greatly Appreciated!
Transcribed Image Text:Q2
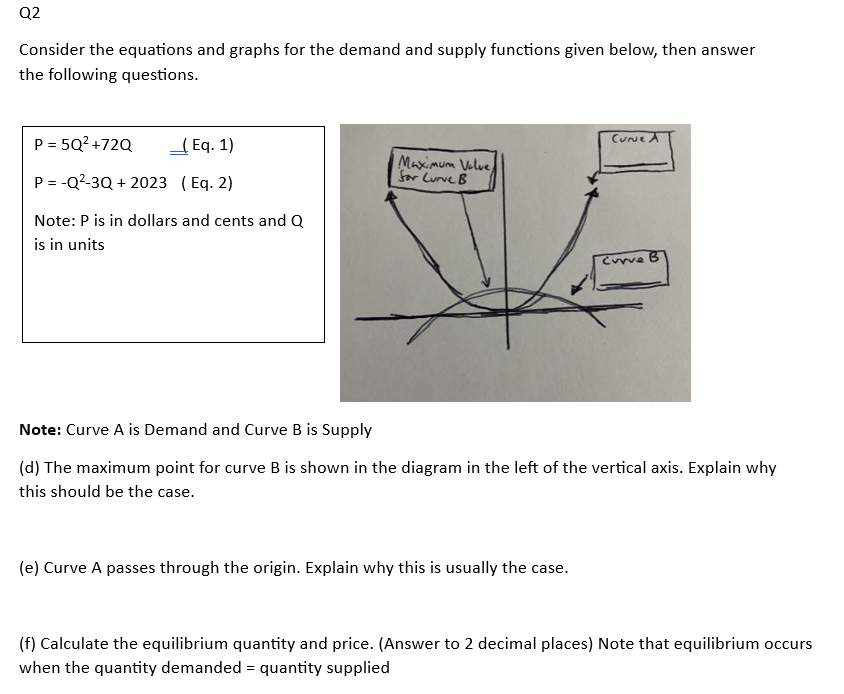
Consider the equations and graphs for the demand and supply functions given below, then answer
the following questions.
P = 5Q²+72Q
Eq. 1)
P = -Q²-3Q+ 2023 (Eq. 2)
Note: P is in dollars and cents and Q
is in units
Maximum Value
for Curve B
Curve A
(e) Curve A passes through the origin. Explain why this is usually the case.
Curve
Note: Curve A is Demand and Curve B is Supply
(d) The maximum point for curve B is shown in the diagram in the left of the vertical axis. Explain why
this should be the case.
(f) Calculate the equilibrium quantity and price. (Answer to 2 decimal places) Note that equilibrium occurs
when the quantity demanded = quantity supplied
Expert Solution
This question has been solved!
Explore an expertly crafted, step-by-step solution for a thorough understanding of key concepts.

Step by step
Solved in 5 steps with 15 images

Knowledge Booster


Learn more about
Need a deep-dive on the concept behind this application? Look no further. Learn more about this topic, economics and related others by exploring similar questions and additional content below.Recommended textbooks for you
Exploring Economics
Economics
ISBN:
9781544336329
Author:
Robert L. Sexton
Publisher:
SAGE Publications, Inc


Exploring Economics
Economics
ISBN:
9781544336329
Author:
Robert L. Sexton
Publisher:
SAGE Publications, Inc


