Sales of tablet computers at Ted Glickman's electronics store in Washington, D.C., over the past 10 weeks are shown in the table below: Week 1 2 3 4 6. 7 8 9 10 Demand 19 21 28 36 26 28 35 22 24 30 a) The forecast for weeks 2 through 10 using exponential smoothing with a = 0.50 and a week 1 initial forecast of 19.0 are (round your responses to two decimal places): Week 1 3 4 6. 9 10 Demand 19 21 28 36 26 28 35 22 24 30 Forecast 19.0
Sales of tablet computers at Ted Glickman's electronics store in Washington, D.C., over the past 10 weeks are shown in the table below: Week 1 2 3 4 6. 7 8 9 10 Demand 19 21 28 36 26 28 35 22 24 30 a) The forecast for weeks 2 through 10 using exponential smoothing with a = 0.50 and a week 1 initial forecast of 19.0 are (round your responses to two decimal places): Week 1 3 4 6. 9 10 Demand 19 21 28 36 26 28 35 22 24 30 Forecast 19.0

Practical Management Science
6th Edition
ISBN:9781337406659
Author:WINSTON, Wayne L.
Publisher:WINSTON, Wayne L.
Chapter13: Regression And Forecasting Models
Section: Chapter Questions
Problem 42P: The file P13_42.xlsx contains monthly data on consumer revolving credit (in millions of dollars)...

Related questions
Question
homework 2 #2
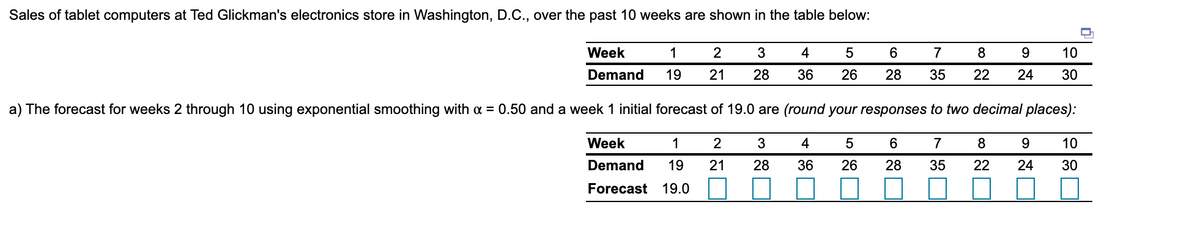
Transcribed Image Text:Sales of tablet computers at Ted Glickman's electronics store in Washington, D.C., over the past 10 weeks are shown in the table below:
Week
1
2
3
4
5
6.
7
8
9
10
Demand
19
21
28
36
26
28
35
22
24
30
a) The forecast for weeks 2 through 10 using exponential smoothing with a = 0.50 and a week 1 initial forecast of 19.0 are (round your responses to two decimal places):
Week
1
2
3
4
5
6
7
8
9.
10
Demand
19
21
28
36
26
28
35
22
24
30
Forecast
19.0
Expert Solution
This question has been solved!
Explore an expertly crafted, step-by-step solution for a thorough understanding of key concepts.

This is a popular solution!

Trending now
This is a popular solution!

Step by step
Solved in 2 steps

Knowledge Booster


Learn more about
Need a deep-dive on the concept behind this application? Look no further. Learn more about this topic, operations-management and related others by exploring similar questions and additional content below.Recommended textbooks for you
Practical Management Science
Operations Management
ISBN:
9781337406659
Author:
WINSTON, Wayne L.
Publisher:
Cengage,

Contemporary Marketing
Marketing
ISBN:
9780357033777
Author:
Louis E. Boone, David L. Kurtz
Publisher:
Cengage Learning

Marketing
Marketing
ISBN:
9780357033791
Author:
Pride, William M
Publisher:
South Western Educational Publishing
Practical Management Science
Operations Management
ISBN:
9781337406659
Author:
WINSTON, Wayne L.
Publisher:
Cengage,
Contemporary Marketing
Marketing
ISBN:
9780357033777
Author:
Louis E. Boone, David L. Kurtz
Publisher:
Cengage Learning
Marketing
Marketing
ISBN:
9780357033791
Author:
Pride, William M
Publisher:
South Western Educational Publishing