for the 8th week using weights of 3, 2, and 1 (where the most recent week receives the highest weight). (Round all forecasts to the nearest whole unit.) b. Calculate the MAD for this forecast. What does the MAD indicate? he number of students enrolled in Spring Valley Elementary school has been steadily acreasing over the past five years. The School Board would like to forecast enrolment or years 6 and 7 in order to better plan capacity. The past five years enrolment is dicated in table 3:
for the 8th week using weights of 3, 2, and 1 (where the most recent week receives the highest weight). (Round all forecasts to the nearest whole unit.) b. Calculate the MAD for this forecast. What does the MAD indicate? he number of students enrolled in Spring Valley Elementary school has been steadily acreasing over the past five years. The School Board would like to forecast enrolment or years 6 and 7 in order to better plan capacity. The past five years enrolment is dicated in table 3:

Practical Management Science
6th Edition
ISBN:9781337406659
Author:WINSTON, Wayne L.
Publisher:WINSTON, Wayne L.
Chapter13: Regression And Forecasting Models
Section13.7: Exponential Smoothing Models
Problem 29P: The file P13_29.xlsx contains monthly time series data for total U.S. retail sales of building...

Related questions
Question
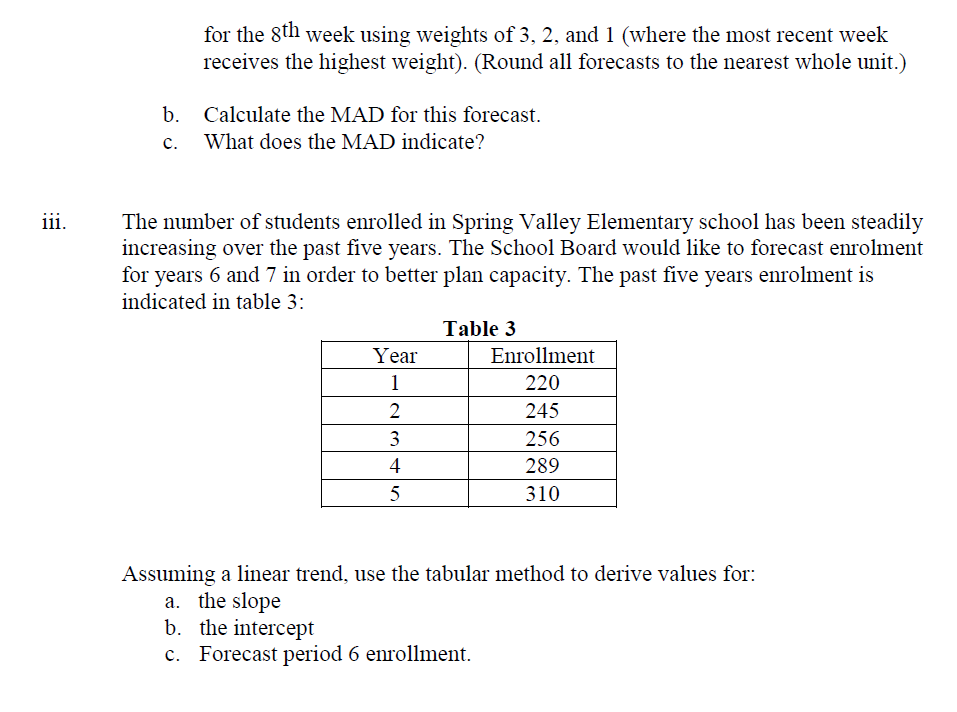
Transcribed Image Text:for the 8th week using weights of 3, 2, and 1 (where the most recent week
receives the highest weight). (Round all forecasts to the nearest whole unit.)
b.
Calculate the MAD for this forecast.
c. What does the MAD indicate?
iii.
The number of students enrolled in Spring Valley Elementary school has been steadily
increasing over the past five years. The School Board would like to forecast enrolment
for years 6 and 7 in order to better plan capacity. The past five years enrolment is
indicated in table 3:
Table 3
Year
Enrollment
1
220
2
245
3
256
4
289
310
Assuming a linear trend, use the tabular method to derive values for:
a. the slope
b. the intercept
c. Forecast period 6 enrollment.
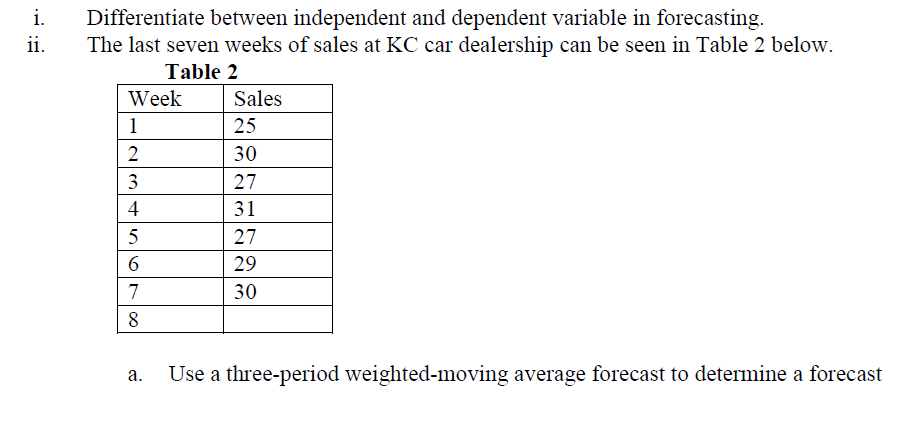
Transcribed Image Text:i.
Differentiate between independent and dependent variable in forecasting.
The last seven weeks of sales at KC car dealership can be seen in Table 2 below.
ii.
Table 2
Week
Sales
1
25
2
30
3
27
4
31
5
27
29
7
30
8
Use a three-period weighted-moving average forecast to determine a forecast
а.
Expert Solution
This question has been solved!
Explore an expertly crafted, step-by-step solution for a thorough understanding of key concepts.

Step by step
Solved in 4 steps with 4 images

Recommended textbooks for you
Practical Management Science
Operations Management
ISBN:
9781337406659
Author:
WINSTON, Wayne L.
Publisher:
Cengage,

Contemporary Marketing
Marketing
ISBN:
9780357033777
Author:
Louis E. Boone, David L. Kurtz
Publisher:
Cengage Learning

Marketing
Marketing
ISBN:
9780357033791
Author:
Pride, William M
Publisher:
South Western Educational Publishing
Practical Management Science
Operations Management
ISBN:
9781337406659
Author:
WINSTON, Wayne L.
Publisher:
Cengage,
Contemporary Marketing
Marketing
ISBN:
9780357033777
Author:
Louis E. Boone, David L. Kurtz
Publisher:
Cengage Learning
Marketing
Marketing
ISBN:
9780357033791
Author:
Pride, William M
Publisher:
South Western Educational Publishing