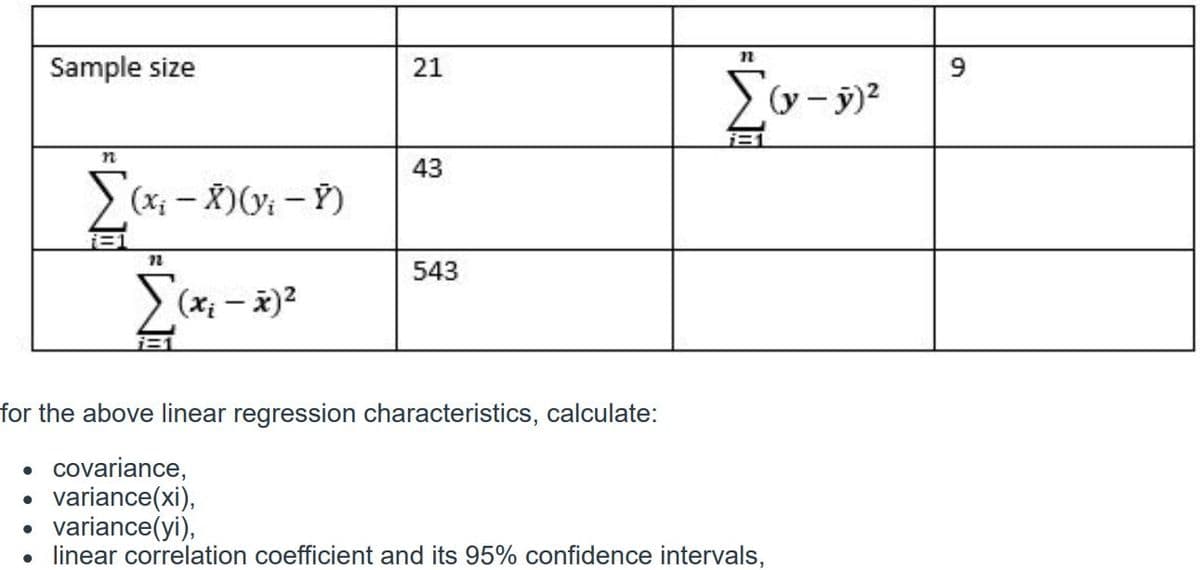
Sample size 21 n 43 > (x; – X)(y: – Y) 543 >(x - 2)2 for the above linear regression characteristics, calculate: • covariance, variance(xi), variance(yi),


Q: (a) Find the least-squares regression line treating number of absences as the explanatory variable…
A: Let X denote the final exam score Let Y denote the sample of college students in a general education…
Q: In order to validate the accuracy of your regression function, the correlation analysis aims to…
A: : Validity of regression analysis. The coefficient of variation (also known as…
Q: People age, the number of hours per week spent on exercise tends to decrease. Here is a random…
A:
Q: Consider the regression Y = a, + az X + a; Z+u. we know that if there is a strong linear correlation…
A: Given statement, 'if there is a strong linear correlation between X and Z then it is more likely…
Q: The line of regression of marks in Statistics (X) on marks in Accountancy (Y) for a kE of 50…
A:
Q: Determine the least squares regression line for the data. Determine the correlation coefficent.
A: The correlation coefficient quantifies the strength of the relationship between 2 variables. The…
Q: Clearly describe the advantages of portfolio diversification. Suppose, the rates of return on two…
A: Portfolio Diversification Portfolio Diversification is the process of investing your money in…
Q: 2k 2k-p designs are desirable for parameter estimation (in regression models) because of the…
A: GIven, the designs are, 2k and 2k-p To find, what property of these designs allow for…
Q: (I) what is the regression equation (ii) What is the sample size used in this investigation?
A: From the given output (I) what is the regression equation (ii) What is the sample size used in this…
Q: You have obtained data on test scores and student-teacher ratios in region A and region B. Region B,…
A: The equation as stated in the question is: Yi=β0 + β1 X1i + β1 X2i + β3 X3i + µi
Q: a. Determine the correlation coefficient r between the two variables. b. Determine the slope…
A: Given :
Q: (a) Assuming a linear regression model for the year (X) and SAT score (Y), please f regression…
A: a) From the given information, X=year Y=Average SAT score Excel Procedure: Enter X and Y data in…
Q: If a student spent 200 minutes preparing for the test, how many points should the student expect to…
A: The regression equation is given by y = 0.11x + 11 Where X-values represent the times, in minutes,…
Q: Test the significance of regression coefficient b at 1% level of significance
A: Regression equation : Y = a + bX + e is the regression equation. The value of the Dependent variable…
Q: Analysis of Variance Source DF MS Regression 1 Residual Error 13 0.2364 Total 14 11.3240 What is the…
A: Solution
Q: 4. Explain the RESET test as a general test for functional form misspecification and discuss the…
A: Mis-specification The mis-specifications in the functional model may have some nonlinearities Model…
Q: Like any statistical procedure, Simple Linear Regression has a certain set of assumptions that must…
A: Let x be the independent variable and y be the dependent variable. Then the regression equation is…
Q: 3. (a). Differentiate the different types of linear regression and describe the use of regression in…
A: (a) Regression: Regression is a technique that is used to determine relationship between two or more…
Q: Two Factor ANOVA How do i fill in the missing values on the chart and find out if the interaction…
A: The two-way ANOVA table with some missing values are given in the data.
Q: Suppose a sample regression equation is given by Yhat - 15 - 0.6 *X. Suppose when X is 5, Y is…
A: The formula of residual is,
Q: You run a regression analysis on a bivariate set of data (n=31). With ¯x=46.3 and ¯y=61.2, you…
A: The regression equation is y=-0.846x+45.999.
Q: Confidence interval for a simple linear regression coefficient Bis: a) b) Se c) d)
A: Given problem Given that Confidence interval for a simple linear regression coefficient B1 is :…
Q: Number 5,6,7 are the number that I need help with. Thanks
A: Hello there! there are multiple questions. According to our policies we cannot answer more than one…
Q: Compare and contrast z-tests, t-tests, correlation, and linear regression.
A: Z-test: This test is used to see if sample mean is different from population mean when population…
Q: Say you have a regression where you are regressing wages on several variables, one being Years of…
A: 1) Regression Equation 1: Wages (Y) = β0 + β1 * Years of Education (X1) where Dependent variable…
Q: .Calculate for the coefficient b in the linear regression equation describing the sample data below.
A:
Q: Disk drives last time Here is a scatterplot of the residu-als from the regression of the hard drive…
A: a. The residual plot for the regression of price on capacity for the hard drives mentioned in…
Q: uestion 11 in simple linear regression model y=6.+8x + e which of the folowing statoments are not…
A: In a simple linear regression model, we have two variables, Y as dependent variable and X as…
Q: The least-squares regression equation is y=620.6x+16,624 where y is the median income and x is the…
A: Linear Regression : Linear Regression analysis is used to measure the association or linear…
Q: Multiple regression analysis was used to study how an individual's income (Y in thousands of…
A: Since we only do up to three sub parts of a problem, we'll be doing the first three sub parts only.…
Q: I proved these exercices for my econometrics class. I just want to make sure that my answer matches.…
A: Hello. Since you have posted multiple questions and not specified which question needs to be solved,…
Q: ne regression equation is computed for a set of n = 18 pairs of X and Y values with a correlation of…
A: Given data,Sample size n=18Correlation r=0.50SSy =48
Q: You are asked to do quality control and quality assurance during the determination of lead…
A: Given Information: The linear regression equation is, y=1.97x+1.50 R2=0.99 and Standard deviation…
Q: Thickness measurements of a coating process are made to the nearest hundredth of a millimeter. The…
A:
Q: You run a regression analysis on a bivariate set of data (n=12). With ¯x=33.8 and ¯y=76., you obtain…
A: Given Regression equation: y=0.392x−57.285 --->(1) When x=80 predicted value=?
Q: Using the accompanying Home Market Value data, develop a multiple linear regression model for…
A: Hypotheses: H0:β1=β2=0 H1: At least βi is not equal to zero.
Q: 1.A math placement test is given to all entering freshmen at a small college. A student who receives…
A: X -course grade Y-placement test There is moderate positive correlation Or relationship between…
Q: i) Explain briefly, two basic assumptions of the multiple linear regression model. ii) State…
A: 1) Two basic assumptions of the multiple linear regression model are: Multiple regression assumes…
Q: You are analyzing a dataset with 932 datapoints. You decide to create a linear regression model with…
A: Given: No. of observation, n=932 No. of predictors, k=18
Q: Use the value of the linear correlation coefficient to calculate the coefficient of determination.…
A: Given , correlation coefficient (r)=-0.884 coefficient of determination (r 2)=?
Q: 4) In a univariate linear regression, explain intuitively, graphically and mathematically, how the…
A: Given Solution:
Q: The least-squares regression equation is y=784.6x+12,431 where y is the median income and x is the…
A: x=26.5% y^=784.6x+12,431
Q: Suppose x1 and x2 are predictor variables for a response variable y. a. The distribution of all…
A: a.It is provided that x1 and x2 are predictor variables for a response variable y.Yes, the…
Q: HYPOTHESIS TEST # 2 Sunoco Oil Company states that in the USA, an average of 1400 people forget to…
A: Step 1: Here we have to test whether the average is higher or not. To test this the null…
Q: (a) Describe how instrumental variable (IV) regression can eliminate the bias when E(u | X)#0, where…
A: Please find the explanation below. Thank you.
Q: Find the slope of regression line, y-intercept of regression line, coefficient of determination…
A: Solution We have given following scatter plot
Q: Probability of event after x hours is 0.74e-0.5x + 0.25e-0.25x Find mean, variance and quartiles of…
A: Probability Density Function: A continuous function f(x) is said to be the probability density…
Q: Larger engines use more gas. Here is data comparing the vehicle engine size in liters to city mile…
A: The independent variable is Size. The dependent variable is City mpg. This is simple linear model.…

Step by step
Solved in 2 steps with 2 images


- Olympic Pole Vault The graph in Figure 7 indicates that in recent years the winning Olympic men’s pole vault height has fallen below the value predicted by the regression line in Example 2. This might have occurred because when the pole vault was a new event there was much room for improvement in vaulters’ performances, whereas now even the best training can produce only incremental advances. Let’s see whether concentrating on more recent results gives a better predictor of future records. (a) Use the data in Table 2 (page 176) to complete the table of winning pole vault heights shown in the margin. (Note that we are using x=0 to correspond to the year 1972, where this restricted data set begins.) (b) Find the regression line for the data in part ‚(a). (c) Plot the data and the regression line on the same axes. Does the regression line seem to provide a good model for the data? (d) What does the regression line predict as the winning pole vault height for the 2012 Olympics? Compare this predicted value to the actual 2012 winning height of 5.97 m, as described on page 177. Has this new regression line provided a better prediction than the line in Example 2?The observations of yields (y) of a chemical reaction taken at various temperatures (x) were recorded in the following table:a) Calculate the correlation coefficient and test the significance at 5% probability;b) Find the simple linear regression equation;c)Calculate the coefficient of determination.d) What is the expected efficiency of the chemical reaction for a temperature of 270 °C?You have run a security characteristic line for a company's stock. The variance is .20. The variance of the error or residuals is .07. The variance of the market is .18. What is the beta? I arrived at .722. And what is the R-square of your regression?
- 1. Explain the purpose or use of the following:a. Linear regression equationb. Correlation coefficient.Suppose the simple linear regression model, Yi = β0 + β1 xi + Ei, is used to explain the relationship between x and y. A random sample of n = 12 values for the explanatory variable (x) was selected and the corresponding values of the response variable (y) were observed. A summary of the statistics is presented in the photo attached. Let b1 denote the least squares estimator of the slope coefficient, β1. What is the value of b1?Find the simple regression line y=α+βx for the pairs of points belonging to the independent and dependent variables (xi,yi) , respectively. Also, interpret the result by calculating the Pearson correlation coefficient.
- With the help of the observations of X and Y variables;a) Estimate and graph the regression equation.b) Estimate the Y value for X = 9.c) Calculate the correlation coefficient. Determine the direction and degree of this relationshipd) Test the hypothesis that p is not different from zero for α = 0.01 and α = 0.05 significance level.1a. Develop an estimated regression equation for these data. 1b. Compute the residuals and standardized residualsUsing the regression table I created, how should I perform a T-test for the predictors and assuming the Normality, Homoscedasticity, Independence of observations are satisfied?
- Find the slope of regression line, y-intercept of regression line, coefficient of determination (r^2), and the linear correlation coefficient (r)An experiment was carried out to observe the relationship between the time (Y) necessary for a vendor to supply a showcase in a store with sodas, and the boxes of product supplied (X), the information recorded is as follows (image) From the data: a. Get the fitted simple linear regression model b. Construct a scatterplot and discuss the result c. perform the analysis of variance. ThanksFor a linear regression for a sample of n=20 pairs of X and Y values. What is the value of the degrees of freedom for the predicted portion of the Y-score variance, MSregression?