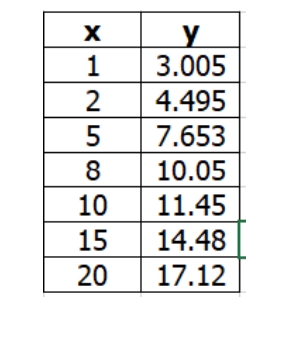
.Calculate for the coefficient b in the linear regression equation describing the sample data below.


Q: Calculate the least square regression line for X on Y of the given data? b) Calculate the…
A: Here, x y x-x y-y (x-x)(y-y) (x-x)2 (y-y)2 5 22 -10.7 -5.6 59.92 114.49 31.36 7 29 -8.7 1.4…
Q: The following scores were collected by a researcher: Participants Y 8. 12 7. 14 17 3. 18 21 23 6. 1.…
A: Note: " Since you have asked multiple sub-parts, we will solve the first three sub-parts for you. If…
Q: The coefficient of determination of a set of data points is 0.709 and the slope of the regression…
A: It is give that slope of the regression line is –3.58.
Q: Calculate the sample correlation coefficient r. Using technology, find the following (show your…
A: Given data indicates the prices (in dollars), and mileage (in thousands of miles) of eight used…
Q: The following results are from a regression where the dependent variable is GRADUATION RATE and the…
A:
Q: For a linear regression for a sample of n=20 pairs of X and Y values. What is the value of the…
A:
Q: The following regression model was fitted to sample data with 12 observations: ŷ = 30 + 4.50x. What…
A: We have given that the following regression model was fitted to sample data with 12 observations: ŷ…
Q: xi 2 6 9 13 20 yi 7 18 9 26 23 The estimated regression equation for these data is ŷ =…
A:
Q: Suppose the simple linear regression model, Y; = Bo + B1 x; + E;, is used to explain the…
A:
Q: Bill is the office manager for a group of financial advisors who provide financial services for…
A: The linear regression equation is of form Follow the steps below to get the Regression equation…
Q: Calculate for the coefficient b in the linear regression equation describing the sample data below…
A: From the given information, X Y 0.0721 0.3891 0.0966 0.4375 0.1238 0.4704 0.1661 0.5089…
Q: Suppose You Determine The Estimated Sample Regression Function To Be Y1 = 687.51 - 3,212.97 . xi .…
A: In simple linear regression, the response variable Y is predicted as a linear function of the…
Q: 7. Why is the strength of the correlation between Y and X important in regression analysis?
A: It is an important part of statistics. It is widely used.
Q: Which of the following best describes the difference between the interpretation of the correlation…
A: Identify the correct option that interprets the difference between the interpretation of the…
Q: 1. What is the correlation of the correlation coefficient for the bivariate data? [Select] 2. Is…
A: The provided information is x y xy x2 y2 1.2 6.7 8.04 1.44 44.89 1.5 7.8 11.7 2.25 60.84…
Q: 1. What are the assumptions underlying multiple regression analysis when one wishes to infer about…
A: 1. Assumptions of the multiple regression analysis: Variable type: Both, categorical and…
Q: Suppose you are investigating a dataset and creating a sample linear regression model that yields a…
A: Researchers conduct t-test to test the usefulness of the slope coefficient.
Q: 4. Suppose you are interested in estimating the ceteris paribus relationship between final exam…
A:
Q: Suppose you are investigating a dataset and creating a sample linear regression model that yields a…
A: Assume that the β1 is the population slope coefficient.
Q: (2) Suppose party affiliation has four categories: Democrats, Republicans, Libertarians, and Others.…
A: Suppose Y (party affiliation) represents the dependent variable. The independent variables are; X1:…
Q: Suppose a commercial developer in Vereeniging consider to purchase a group of small office buildings…
A: Given information: The value of coefficient of determination is r2 = 0.9752. The number of predictor…
Q: 13. What proportion of the variance in Course % is attributable to the regression model? A- .568…
A: 13) The proportion of variance in course is attributable to the regression model is R-square.
Q: 5) The ages (X) of ten second-hand cars and their km values (Y) are given below. a) Calculate the…
A: Solution: n= 7 observation x y xy x^2 y^2 4.8 45 216 23.04 2025 2.5 26 65 6.25 676 5.5 50…
Q: The random sample of 5 school students is selected and their marks in statistics and accountancy are…
A: The regression line are used to predict the future values. There are two types of regression lines,…
Q: You have estimated a multiple regression model with 6 explanatory variables and an intercept from a…
A: Given: Sample size, n = 46 k = 6 α = 0.05 significance level.
Q: The regression equation is Ý = 29.29 – 0.96X, the sample size is 8, and the standard error of the…
A: Given that Sample size n = 8 Standard error of slope = 0.22 Level of significance = 0.01
Q: 1. The amount of water discharged by the Davao River has changed over time in roughly a…
A: Let Y denote the discharge and X denote the year. The regression line for amount of water discharged…
Q: If a new independent variable is added to an existing regression equation then the resulting sample…
A:
Q: The ages (X) of ten second-hand cars and their km values (Y) are given below. a) Calculate the…
A: Data given X: 3.3, 5.8,3,4.5,1.8,3.9,2 Y:35,60,21,55,34,45,2
Q: In simple linear regression, most often we perform a two-tail test of the population slope 1 to…
A: The study is about performing a two-tail test of the population slope 1 to determine whether there…
Q: The sample regression line Y, A+bX, provides a measure of O1. the estimated population value of the…
A: Given that The sample regression line Y=A+bX, provides a measure of : Here Y is called the…
Q: You were given a dataset that includes 100 datapoints for expenses in Canadian dollars and waste in…
A: The independent variable is Expenses. The dependent variable is Waste amount. This is simple linear…
Q: Explain why the predictor variable is useless as a predictor of the response variable if the slope…
A:
Q: 3. In some data sets, there are values that are far from the linear regression line. What are the…
A: In some data sets, there are values that are far from the linear regression line. What are the data…
Q: In the simple linear regression Y = 20 5X, if the coefficient of determination is 0.8, then the…
A: A negative coefficient suggests that as the independent variable increases, the dependent variable…
Q: 25/ A: Use Linear Regression to fit the following experimental data
A: Given, X 0 3 2 3 1 6 5 Y 5 1 2 10 9 8 10
Q: Consider the following data set. a) plot the data (y versus x). Are there any points that appear…
A: The independent variable is x. The dependent variable is y. This is simple linear regression model.…
Q: In a simple linear regression, given that the sample variances of x and y Sx^2=510, Sy^2=750…
A: Provided information is ; Sample variance of x=(Sx2 )= 510 , Sx=510 = 22.5832 Sample…
Q: 1) What is the slope(b1) and what is its statistical interpretation?
A:
Q: 3 4 5 6 y 5.6 4.5 4.5 3.8 3.2 2.6 Use the given data given to construct the ANOVA table for a simple…
A: We have to construct anova table. Fot which we have to first calculate slope and intercept, some…
Q: You are given the following sample data: X 10 14 16 12 Y 120 130 170 150 a. Determine the…
A: Ans is given in the below image.
Q: The data is given as follow. xi 2 6 9 13 20 yi 7 18 9 26 23 The estimated regression equation…
A:
Q: The slope b of the sample regression line provides a measure of O1. the change in the population…
A:
Q: onsider the data. xi 2 6 9 13 20 yi 6 16 9 24 22 a. The estimated regression equation for these data…
A: Solution: The estimated regression equation is y^=6.4+0.9x
Q: A county real estate appraiser wants to develop a statistical model to predict the appraised value…
A: y^ = 91.80+19.72x slope = 19.72 x= no. of rooms y = appraise value (in thousands)
Q: The following table lists the monthly incomes (in hundreds of dollars) and the monthly rents paid…
A: The table lists the monthly incomes (in hundreds of dollars) and the monthly rents paid (in hundreds…
Q: 7.Why is the strength of the correlation between Y and X important in regression analysis?
A: Let Y be the dependent variable and X be the independent variable in the regression analysis.
Q: c). Find the equation of the sample regression line using Minitab. d). Interpret the meaning of…
A: c) Let x be the price and y be the sales. The regression equation is obtained by using MINITAB:…
Q: Suppose that x and y are two variables of a population and that the assumptions for regression…
A:

Step by step
Solved in 2 steps with 2 images
