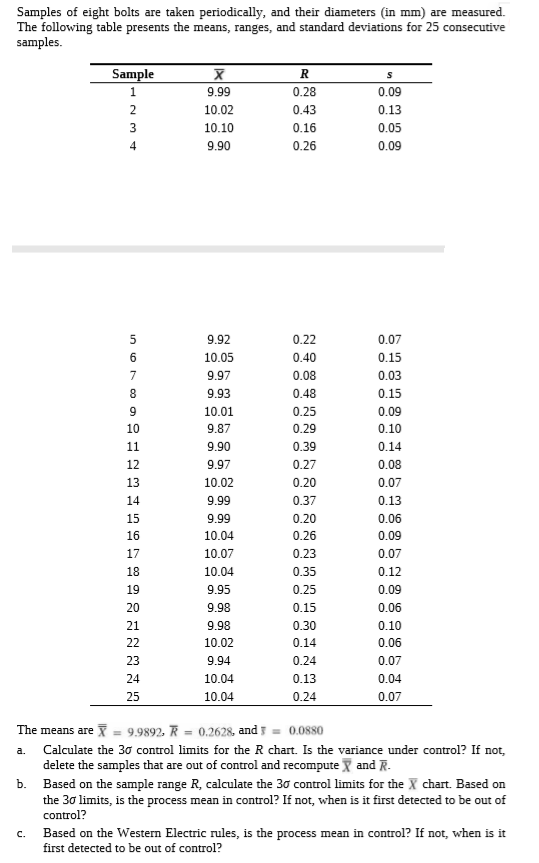
Samples of eight bolts are taken periodically, and their diameters (in mm) are measured. The following table presents the means, ranges, and standard deviations for 25 consecutive samples. Sample х R 1. 9.99 0.28 0.09 2 10.02 0.43 0.13 10.10 0.16 0.05 9.90 0.26 0.09 9.92 0.22 0.07 10.05 0.40 0.15 9.97 0.08 0.03 9.93 0.48 0.15 10.01 0.25 0.09 10 9.87 0.29 0.10 11 9.90 0.39 0.14 12 9.97 0.27 0.08 13 10.02 0.20 0.07 14 9.99 0.37 0.13 15 9.99 0.20 0.06 16 10.04 0.26 0.09 17 10.07 0.23 0.07 18 10.04 0.35 0.12 19 9.95 0.25 0.09 20 9.98 0.15 0.06 21 9.98 0.30 0.10 22 10.02 0.14 0.06 23 9.94 0.24 0.07 24 10.04 0.13 0.04 25 10.04 0.24 0.07 The means are X = 9.9892, R = 0.2628, and = 0.0880 Calculate the 30 control limits for the R chart. Is the variance under control? If not, delete the samples that are out of control and recompute Y and R. a. b. Based on the sample range R, calculate the 30 control limits for the X chart. Based on the 30 limits, is the process mean in control? If not, when is it first detected to be out of control? Based on the Western Electric rules, is the process mean in control? If not, when is it first detected to be out of control? C. 4.
Samples of eight bolts are taken periodically, and their diameters (in mm) are measured. The following table presents the means, ranges, and standard deviations for 25 consecutive samples. Sample х R 1. 9.99 0.28 0.09 2 10.02 0.43 0.13 10.10 0.16 0.05 9.90 0.26 0.09 9.92 0.22 0.07 10.05 0.40 0.15 9.97 0.08 0.03 9.93 0.48 0.15 10.01 0.25 0.09 10 9.87 0.29 0.10 11 9.90 0.39 0.14 12 9.97 0.27 0.08 13 10.02 0.20 0.07 14 9.99 0.37 0.13 15 9.99 0.20 0.06 16 10.04 0.26 0.09 17 10.07 0.23 0.07 18 10.04 0.35 0.12 19 9.95 0.25 0.09 20 9.98 0.15 0.06 21 9.98 0.30 0.10 22 10.02 0.14 0.06 23 9.94 0.24 0.07 24 10.04 0.13 0.04 25 10.04 0.24 0.07 The means are X = 9.9892, R = 0.2628, and = 0.0880 Calculate the 30 control limits for the R chart. Is the variance under control? If not, delete the samples that are out of control and recompute Y and R. a. b. Based on the sample range R, calculate the 30 control limits for the X chart. Based on the 30 limits, is the process mean in control? If not, when is it first detected to be out of control? Based on the Western Electric rules, is the process mean in control? If not, when is it first detected to be out of control? C. 4.

MATLAB: An Introduction with Applications
6th Edition
ISBN:9781119256830
Author:Amos Gilat
Publisher:Amos Gilat
Chapter1: Starting With Matlab
Section: Chapter Questions
Problem 1P

Related questions
Question
Transcribed Image Text:Samples of eight bolts are taken periodically, and their diameters (in mm) are measured.
The following table presents the means, ranges, and standard deviations for 25 consecutive
samples.
Sample
х
R
1.
9.99
0.28
0.09
2
10.02
0.43
0.13
10.10
0.16
0.05
9.90
0.26
0.09
9.92
0.22
0.07
10.05
0.40
0.15
9.97
0.08
0.03
9.93
0.48
0.15
10.01
0.25
0.09
10
9.87
0.29
0.10
11
9.90
0.39
0.14
12
9.97
0.27
0.08
13
10.02
0.20
0.07
14
9.99
0.37
0.13
15
9.99
0.20
0.06
16
10.04
0.26
0.09
17
10.07
0.23
0.07
18
10.04
0.35
0.12
19
9.95
0.25
0.09
20
9.98
0.15
0.06
21
9.98
0.30
0.10
22
10.02
0.14
0.06
23
9.94
0.24
0.07
24
10.04
0.13
0.04
25
10.04
0.24
0.07
The means are X
= 9.9892, R = 0.2628, and = 0.0880
Calculate the 30 control limits for the R chart. Is the variance under control? If not,
delete the samples that are out of control and recompute Y and R.
a.
b.
Based on the sample range R, calculate the 30 control limits for the X chart. Based on
the 30 limits, is the process mean in control? If not, when is it first detected to be out of
control?
Based on the Western Electric rules, is the process mean in control? If not, when is it
first detected to be out of control?
C.
4.
Expert Solution


Trending now
This is a popular solution!

Step by step
Solved in 9 steps with 7 images

Recommended textbooks for you
MATLAB: An Introduction with Applications
Statistics
ISBN:
9781119256830
Author:
Amos Gilat
Publisher:
John Wiley & Sons Inc

Probability and Statistics for Engineering and th…
Statistics
ISBN:
9781305251809
Author:
Jay L. Devore
Publisher:
Cengage Learning

Statistics for The Behavioral Sciences (MindTap C…
Statistics
ISBN:
9781305504912
Author:
Frederick J Gravetter, Larry B. Wallnau
Publisher:
Cengage Learning
MATLAB: An Introduction with Applications
Statistics
ISBN:
9781119256830
Author:
Amos Gilat
Publisher:
John Wiley & Sons Inc
Probability and Statistics for Engineering and th…
Statistics
ISBN:
9781305251809
Author:
Jay L. Devore
Publisher:
Cengage Learning
Statistics for The Behavioral Sciences (MindTap C…
Statistics
ISBN:
9781305504912
Author:
Frederick J Gravetter, Larry B. Wallnau
Publisher:
Cengage Learning

Elementary Statistics: Picturing the World (7th E…
Statistics
ISBN:
9780134683416
Author:
Ron Larson, Betsy Farber
Publisher:
PEARSON

The Basic Practice of Statistics
Statistics
ISBN:
9781319042578
Author:
David S. Moore, William I. Notz, Michael A. Fligner
Publisher:
W. H. Freeman

Introduction to the Practice of Statistics
Statistics
ISBN:
9781319013387
Author:
David S. Moore, George P. McCabe, Bruce A. Craig
Publisher:
W. H. Freeman