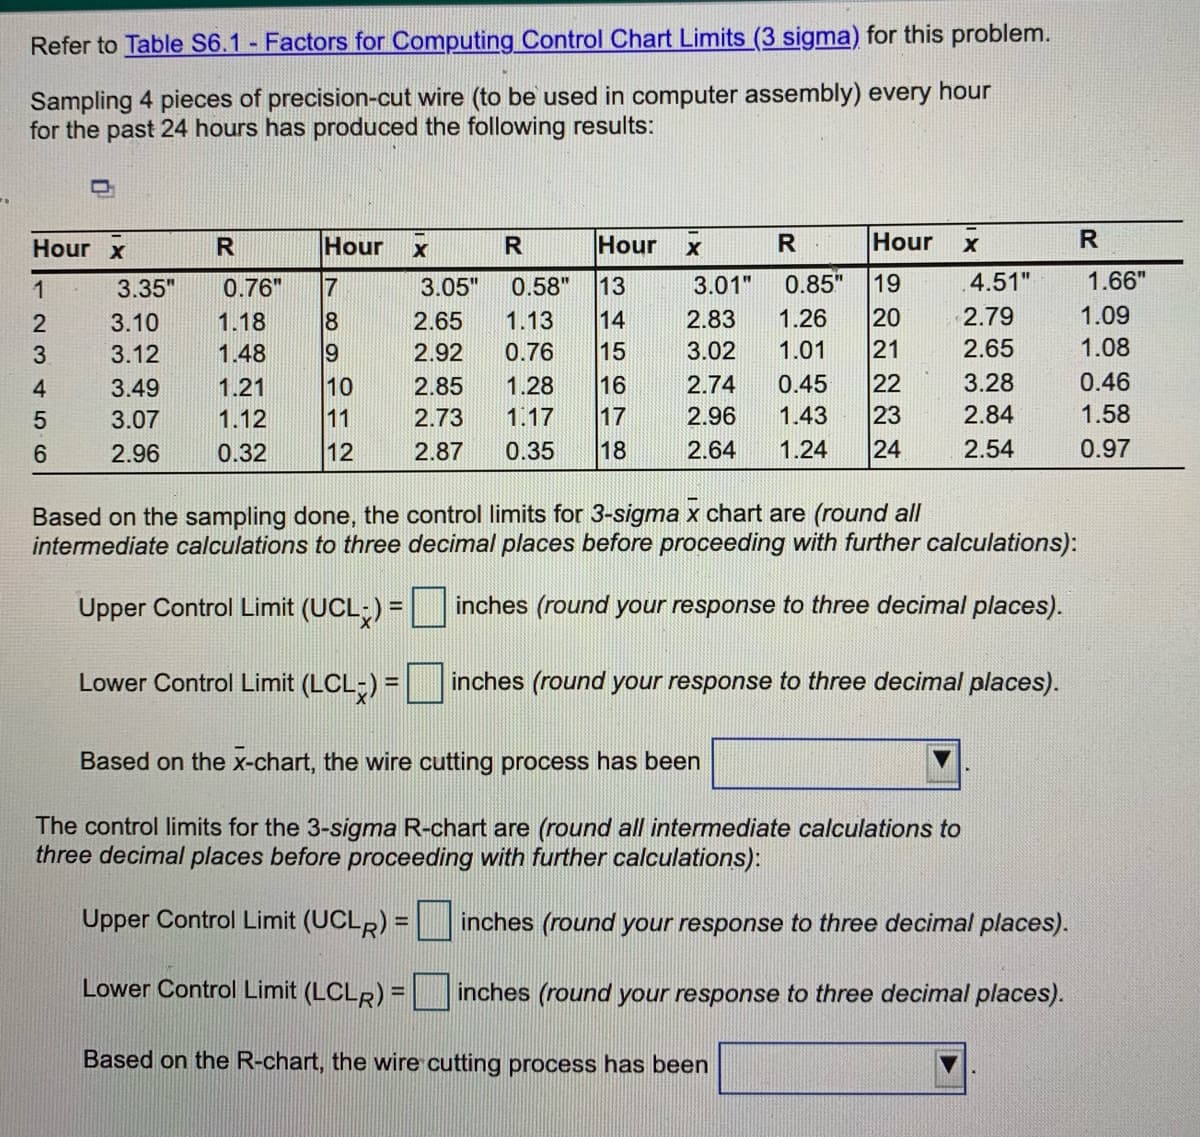
Sampling 4 pieces of precision-cut wire (to be used in computer assembly) every hour for the past 24 hours has produced the following results: Hour x R Hour Hour Hour R 0.85" 4.51" 1.66" 13 14 15 16 17 18 1 3.35" 0.76" 3.05" 0.58" 3.01" 19 20 21 22 23 24 3.10 1.18 2.65 1.13 2.83 1.26 2.79 1.09 3.02 1.01 2.65 1.08 9 10 11 3. 3.12 1.48 2.92 0.76 4 3.49 1.21 2.85 1.28 2.74 0.45 3.28 0.46 3.07 1.12 2.73 1.17 2.96 1.43 2.84 1.58 6 2.96 0.32 12 2.87 0.35 2.64 1.24 2.54 0.97 Based on the sampling done, the control limits for 3-sigma x chart are (round all intermediate calculations to three decimal places before proceeding with further calculations): Upper Control Limit (UCL;) = inches (round your response to three decimal places). %3D Lower Control Limit (LCL;) = inches (round your response to three decimal places). Based on the x-chart, the wire cutting process has been The control limits for the 3-sigma R-chart are (round all intermediate calculations to three decimal places before proceeding with further calculations): Upper Control Limit (UCLR) = inches (round your response to three decimal places). Lower Control Limit (LCLR) = inches (round your response to three decimal places). %3D Based on the R-chart, the wire cutting process has been
Sampling 4 pieces of precision-cut wire (to be used in computer assembly) every hour for the past 24 hours has produced the following results: Hour x R Hour Hour Hour R 0.85" 4.51" 1.66" 13 14 15 16 17 18 1 3.35" 0.76" 3.05" 0.58" 3.01" 19 20 21 22 23 24 3.10 1.18 2.65 1.13 2.83 1.26 2.79 1.09 3.02 1.01 2.65 1.08 9 10 11 3. 3.12 1.48 2.92 0.76 4 3.49 1.21 2.85 1.28 2.74 0.45 3.28 0.46 3.07 1.12 2.73 1.17 2.96 1.43 2.84 1.58 6 2.96 0.32 12 2.87 0.35 2.64 1.24 2.54 0.97 Based on the sampling done, the control limits for 3-sigma x chart are (round all intermediate calculations to three decimal places before proceeding with further calculations): Upper Control Limit (UCL;) = inches (round your response to three decimal places). %3D Lower Control Limit (LCL;) = inches (round your response to three decimal places). Based on the x-chart, the wire cutting process has been The control limits for the 3-sigma R-chart are (round all intermediate calculations to three decimal places before proceeding with further calculations): Upper Control Limit (UCLR) = inches (round your response to three decimal places). Lower Control Limit (LCLR) = inches (round your response to three decimal places). %3D Based on the R-chart, the wire cutting process has been

MATLAB: An Introduction with Applications
6th Edition
ISBN:9781119256830
Author:Amos Gilat
Publisher:Amos Gilat
Chapter1: Starting With Matlab
Section: Chapter Questions
Problem 1P

Related questions
Question
Transcribed Image Text:Refer to Table S6.1 Factors for Computing Control Chart Limits (3 sigma) for this problem.
Sampling 4 pieces of precision-cut wire (to be used in computer assembly) every hour
for the past 24 hours has produced the following results:
Hour x
Hour
Hour
Hour
0.85"
19
20
21
22
23
24
.4.51"
1.66"
13
14
15
16
17
18
1
3.35"
0.76"
17
3.05"
0.58"
3.01"
3.10
1.18
8
2.65
1.13
2.83
1.26
2.79
1.09
3.12
1.48
2.92
0.76
3.02
1.01
2.65
1.08
0.45
3.28
0.46
10
11
12
4
3.49
1.21
2.85
1.28
2.74
3.07
1.12
2.73
1.17
2.96
1.43
2.84
1.58
6.
2.96
0.32
2.87
0.35
2.64
1.24
2.54
0.97
Based on the sampling done, the control limits for 3-sigma x chart are (round all
intermediate calculations to three decimal places before proceeding with further calculations):
Upper Control Limit (UCL;) =
inches (round your response to three decimal places).
Lower Control Limit (LCL;) =
inches (round your response to three decimal places).
Based on the x-chart, the wire cutting process has been
The control limits for the 3-sigma R-chart are (round all intermediate calculations to
three decimal places before proceeding with further calculations):
Upper Control Limit (UCLR) =
inches (round your response to three decimal places).
Lower Control Limit (LCLR) =
inches (round your response to three decimal places).
Based on the R-chart, the wire cutting process has been
Expert Solution
This question has been solved!
Explore an expertly crafted, step-by-step solution for a thorough understanding of key concepts.

This is a popular solution!

Trending now
This is a popular solution!

Step by step
Solved in 2 steps with 3 images

Recommended textbooks for you
MATLAB: An Introduction with Applications
Statistics
ISBN:
9781119256830
Author:
Amos Gilat
Publisher:
John Wiley & Sons Inc

Probability and Statistics for Engineering and th…
Statistics
ISBN:
9781305251809
Author:
Jay L. Devore
Publisher:
Cengage Learning

Statistics for The Behavioral Sciences (MindTap C…
Statistics
ISBN:
9781305504912
Author:
Frederick J Gravetter, Larry B. Wallnau
Publisher:
Cengage Learning
MATLAB: An Introduction with Applications
Statistics
ISBN:
9781119256830
Author:
Amos Gilat
Publisher:
John Wiley & Sons Inc
Probability and Statistics for Engineering and th…
Statistics
ISBN:
9781305251809
Author:
Jay L. Devore
Publisher:
Cengage Learning
Statistics for The Behavioral Sciences (MindTap C…
Statistics
ISBN:
9781305504912
Author:
Frederick J Gravetter, Larry B. Wallnau
Publisher:
Cengage Learning

Elementary Statistics: Picturing the World (7th E…
Statistics
ISBN:
9780134683416
Author:
Ron Larson, Betsy Farber
Publisher:
PEARSON

The Basic Practice of Statistics
Statistics
ISBN:
9781319042578
Author:
David S. Moore, William I. Notz, Michael A. Fligner
Publisher:
W. H. Freeman

Introduction to the Practice of Statistics
Statistics
ISBN:
9781319013387
Author:
David S. Moore, George P. McCabe, Bruce A. Craig
Publisher:
W. H. Freeman