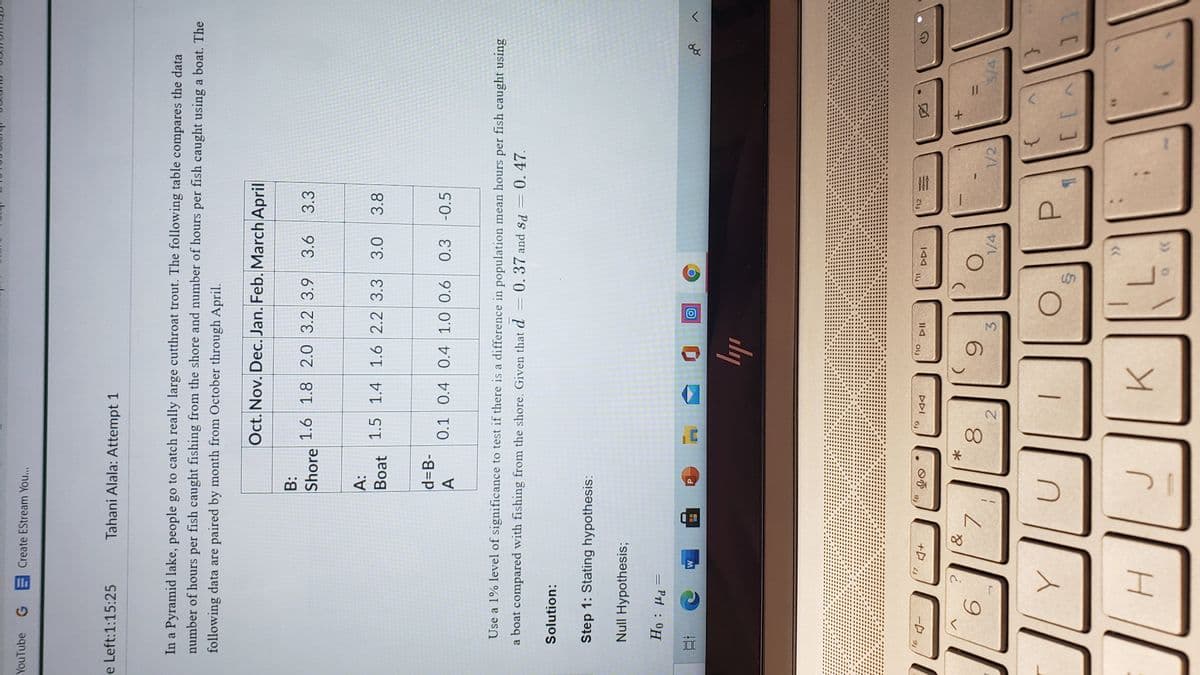
uTube G E Create EStream You... Left:1:15:25 Tahani Alala: Attempt 1 In a Pyramid lake, people go to catch really large cutthroat trout. The following table compares the data number of hours per fish caught fishing from the shore and number of hours per fish caught using a boat. The following data are paired by month from October through April. Oct. Nov. Dec. Jan. Feb. March April B: Shore 1.6 1.8 2.0 3.2 3.9 3.6 3.3 A: Boat 1.5 1.4 1.6 2.2 3.3 3.0 3.8 d=B- A 0.1 0.4 0.4 1.0 0.6 0.3 -0.5 Use a 1% level of significance to test if there is a difference in population mean hours per fish caught using a boat compared with fishing from the shore. Given that d =0.37 and sd = 0. 47. Solution: Step 1: Stating hypothesis: Null Hypothesis; %3D Prl : H

Glencoe Algebra 1, Student Edition, 9780079039897, 0079039898, 2018
18th Edition
ISBN:9780079039897
Author:Carter
Publisher:Carter
Chapter4: Equations Of Linear Functions
Section4.6: Regression And Median-fit Lines
Problem 2CYU
icon
Related questions
icon
Concept explainers
Topic Video
Question
YouTube G Create EStream You...
e Left:1:15:25
Tahani Alala: Attempt 1
In a Pyramid lake, people go to catch really large cutthroat trout. The following table compares the data
number of hours per fish caught fishing from the shore and number of hours per fish caught using a boat. The
following data are paired by month from October through April.
Oct. Nov. Dec. Jan. Feb. March April
B:
Shore 1.6 1.8
2.0 3.2 3.9 3.6
3.3
A:
Boat
1.5 1.4 1.6 2.2 3.3
3.0
3.8
d3DB-
A
0.1 0.4 0.4 1.0 0.6
-0.5
Use a 1% level of significance to test if there is a difference in population mean hours per fish caught using
a boat compared with fishing from the shore. Given that d = 0.37 and Sd = 0.47.
Solution:
Step 1: Stating hypothesis:
Null Hypothesis;
= Pl : 0H
五
ily
f7
f8
f12
61
DDI
|44
*
6.
3.
%3D
8.
1/2
1/4
3/4
>>
Transcribed Image Text:YouTube G Create EStream You... e Left:1:15:25 Tahani Alala: Attempt 1 In a Pyramid lake, people go to catch really large cutthroat trout. The following table compares the data number of hours per fish caught fishing from the shore and number of hours per fish caught using a boat. The following data are paired by month from October through April. Oct. Nov. Dec. Jan. Feb. March April B: Shore 1.6 1.8 2.0 3.2 3.9 3.6 3.3 A: Boat 1.5 1.4 1.6 2.2 3.3 3.0 3.8 d3DB- A 0.1 0.4 0.4 1.0 0.6 -0.5 Use a 1% level of significance to test if there is a difference in population mean hours per fish caught using a boat compared with fishing from the shore. Given that d = 0.37 and Sd = 0.47. Solution: Step 1: Stating hypothesis: Null Hypothesis; = Pl : 0H 五 ily f7 f8 f12 61 DDI |44 * 6. 3. %3D 8. 1/2 1/4 3/4 >>
Expert Solution
steps

Step by step

Solved in 2 steps with 1 images

Blurred answer
Knowledge Booster
Centre, Spread, and Shape of a Distribution
Learn more about
Need a deep-dive on the concept behind this application? Look no further. Learn more about this topic, statistics and related others by exploring similar questions and additional content below.
Recommended textbooks for you
Glencoe Algebra 1, Student Edition, 9780079039897…
Algebra
ISBN:
9780079039897
Author:
Carter
Publisher:
McGraw Hill
Big Ideas Math A Bridge To Success Algebra 1: Stu…
Algebra
ISBN:
9781680331141
Author:
HOUGHTON MIFFLIN HARCOURT
Publisher:
Houghton Mifflin Harcourt
Holt Mcdougal Larson Pre-algebra: Student Edition…
Algebra
ISBN:
9780547587776
Author:
HOLT MCDOUGAL
Publisher:
HOLT MCDOUGAL
Functions and Change: A Modeling Approach to Coll…
Algebra
ISBN:
9781337111348
Author:
Bruce Crauder, Benny Evans, Alan Noell
Publisher:
Cengage Learning