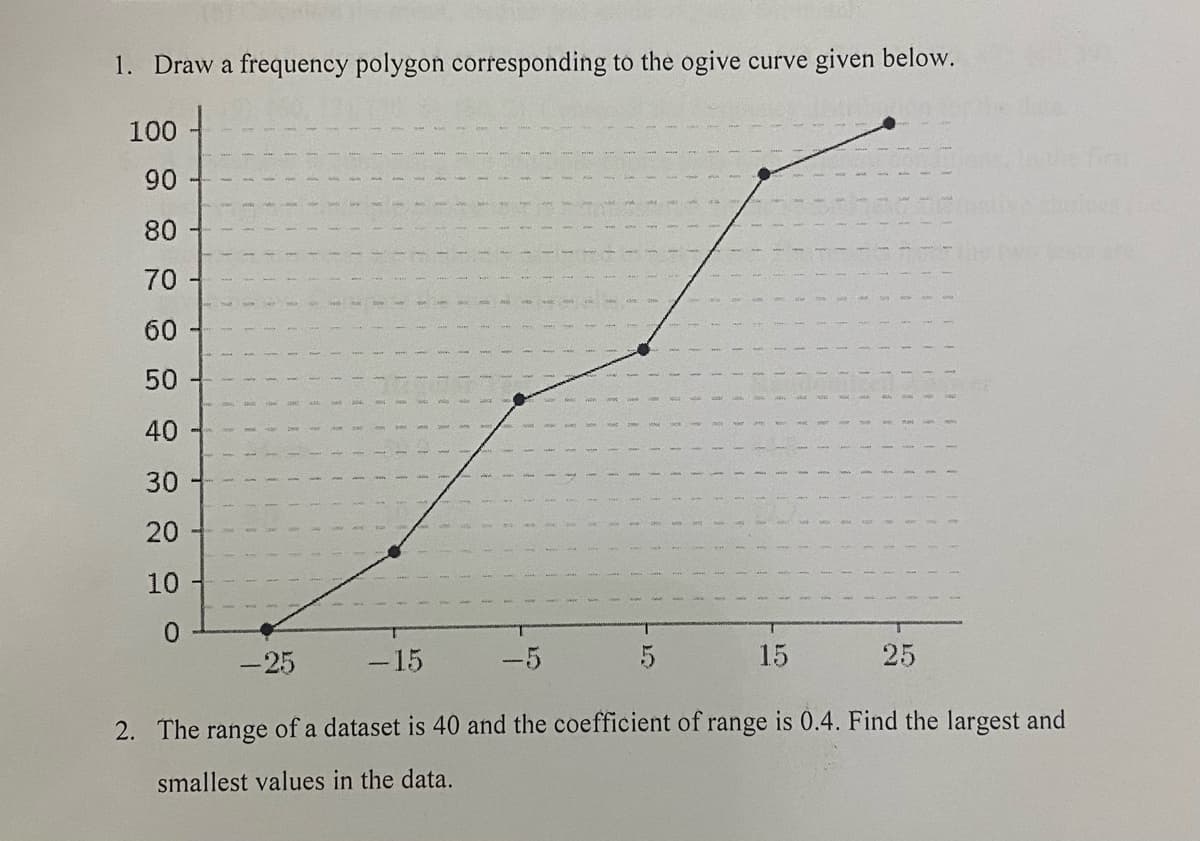
1. Draw a frequency polygon corresponding to the ogive curve given below. 100 90 80 70 60 50 40 30 20 10 0. -25 -15 -5 15 25 2. The of a dataset is 40 and the coefficient of range is 0.4. Find the largest and range smallest values in the data.


Q: 3. Find A.M. from the following frequency distribution. Wages No. of workers 100 120 140 160 180 200…
A:
Q: The given data represent the number of people from a town, aged 25-64, who subscribe to a certain…
A: Age People 25-34 502 35-44 827 45-54 230 55-64 85
Q: Consider the following frequency table representing the distribution of hours students study for an…
A: Steps to find class boundaries : 1) Subtract the upper class limit for the first class from the…
Q: Q2) Draw a Histogram & Frequency Polygon for the given data. Class 10 – 19 20 - 29 30 - 39 40 - 49…
A: Given : Class Intervals Frequency 11-19 7 20-29 13 30-39 22 40-49 11 50-59 6 60-69…
Q: Here is a data set: 165 174 280 178 188 199 198 179 259 160 251 283 246 280 142 204 78 321 191 139…
A: The question is about grouped frequency distribution Given :
Q: Consider the following frequency table representing the scores on a test. Scores on a Test Class…
A: Given, The class frequency table We need to determine the lower class boundary for the second…
Q: 85 2. 80 3. 75 15 70 20 65 50 60 45 55 30 50 15 Speed of Highway Drivers 60 50 40 30 20 10 50 55 60…
A: From the given information we want to solution for part a.
Q: Consider the following ordered data. 2 5 5 6 7 7 8 9 10 (a) Find the low, Q1,…
A: a.)The sorted data set is 2,5,5,6,7,7,8,9,10.The lowest value and the highest values are 2 and 10…
Q: You are given the following frequency distribution. Class Frequency A 15 B 20 C 30 D 35 Then, the…
A: Here total frequency=15+20+30+35 =100
Q: A firm reported that its Net Worth in the years 2011-2016 are as follows: Year 2011 -2012 2012 2013…
A:
Q: The table below shows the frequency distribution for the number of minutes per week spent watching…
A: Given “Since you have posted a question with multiple sub-parts, we will solve first three subparts…
Q: 3 The heights, in cm, of 32 female gymnasts were recorded: 148 152 147 149 150 147 151 142 156 148…
A: The given data of 32 females gymnasts height 148 152 147 149 150 147 151 142 156…
Q: 3. Given below are the marks obtained by 200 studentsS of a university in statistics pane 50-60…
A: Given that Marks 40-50 50-60 60-70 70-80 80-90 No. of students 32 42 55 40 31
Q: the next subset which is answers d and e The following data give the heights in centimeters of a…
A: Note: Provide the next subset which is answers d and e The following data give the heights in…
Q: What are the class limits for the third class? Multiple Choice 75 and up to 78 78 and 80 78…
A: It is given that the first two class midpoints are 73.5" and 76.5".
Q: 1. Below is a sample of 20 house prices (in thousands of pounds) from an estate agent in a small…
A: As per Bartleby guideline for more than three question asked only first three is to be answered…
Q: (1 point) The U.S. Bureau of the Census conducts nationwide surveys on characteristics of U.S.…
A:
Q: 2 For the following data, state whether a frequency histogram or a column graph should be used, and…
A: Data can be organized graphically for interpretation in a single glance in Statistics. The two forms…
Q: The following frequency table gives the height (in inches) of 100 students in a college. Heights…
A:
Q: The data shown represent the ages of our lecturers at the University of Wraith Al-Anhiyaa, find: 1)…
A: Since you have asked multiple question, we will solve the first question for you. If you want any…
Q: Can you help me? This is the complete question. (This is not graded but, rather, an exercise to…
A: Step by step procedure to draw frequency polygon using EXCEL is shown below: Enter data in Excel…
Q: 2. A group of adults where asked how many cars they had in their household a. Complete the frequency…
A: The given data is as follows:
Q: 3. Given the following Frequency Table find: a. Lower class limits b. Upper class limits c. Class…
A:
Q: 2.31 The median income for a four-person family has been reported as shown here for 1993–2003.…
A: We are given the median income of four persons family from the year 1993 to 2003 .…
Q: 1. The height of 30 students of Mathematics, Science & Computer Department was measured in cm. The…
A: Given information: 163, 163, 164, 165, 166, 168, 169, 170, 170, 171, 171, 172, 173, 175, 175, 175,…
Q: Consider the following frequency table representing the distribution of hours students study for an…
A: Lower class boundary for the fifth class = ?
Q: Two other students attempt to draw the ogive for the frequency table. Which, if either, of the…
A: An Ogive is a statistical curve that plots the cumulative frequencies of a dataset through a polygon…
Q: The data shown represent the ages of our lecturers at the University of Wraith Al-Anbiyaa, find: 1)…
A: 1) Frequency table is constructed below: Let us consider the number of classes as 6, class width as…
Q: 1. The data set represents the number of minutes a sample of 25 people exercise each week. 108 139…
A: Since you have posted a question with multiple sub-parts, we will solve first three subparts for…
Q: The given data represent the number of people from a town, aged 25-64, who subscribe to a certain…
A: a) Step-by-step software procedure to draw using Excel software is given below: Enter the data…
Q: Here is a data set: 89 162 103 112 160 114 109 111 107 163 82 82 119 120 109 91 90 145 126 128 117…
A: Minimum Value = 82 Maximum Value = 177 Therefore Range = 177 - 82 =…
Q: From the Previous example in Lec.5 Find: 1- The median 2-The Mode 3- The relative Frequency…
A: we know formula of median median = E(fixi) / E(fi) where fi = frequency and xi = mid class
Q: 2 The number of goals scored in 25 female hockey matches is as follows: 0314 2 3 4 0 1 0526 3 13 3 2…
A: a) First table represents the scores of female players and second table represents the score of male…
Q: We have a sample of 103 observations, which range in value from 25 to 67. Which of the following…
A: Option c is correct . If we take 6 classes of width 7, with minimum value 25, then possible classes…
Q: 1. For the given data: 48 18 20 21 22 23 24 25 26 27 28 29 30 30 31 31 32 32 33 33 34 35 36 37 38 39…
A: For the given data Find ( a ) Frequency diagram with 7 classes ( b ) Draw Histogram ( c ) Find Five…
Q: 7. Prepare a histogram and frequency polygon from the following data. X 0 10 10-20 f 13 17 20-30…
A:
Q: The given data represent the number of people from a town, aged 25-64, who subscribe to a certain…
A: Given data, Calculate mid points to the class intervals i.e., (25+34)/2 ... and…
Q: The following is a sample of prices, rounded to the nearest cent, charged per gallon of standard…
A: Given: Sample size n = 13 Formula Used: Relative frequency = Frequencyn
Q: (a) If 75% of the items were sold in birr 45 or less and most items were sold in birr 34, find the…
A:
Q: 2. For the above data draw frequency curve.
A:
Q: If the range of a given dataset(of quiz score) is 32 and and the desired number of classes is 7,…
A:
Q: The principal of a particular school received a report on the number of students enrolled (per day)…
A: Since you have posted a question with multiple sub-parts, we will solve first three sub-parts for…
Q: Which of the following may be determined from the height of the bar in a relative frequency…
A: d. The number of observations that fall into that class.
Q: From the Previous example in Lec.5 Find: 1- The median 2- The Mode 3- The relative Frequency…
A: Mean, median, mode, etc are the different types of average. The average is the single value that…
Q: 6. Below is a frequency distribution. Classes 0-14 4. 15-29 18 30-44 12
A: (a) - Mean deviation : Mean ˉx∑fx/∑f =1649/47 =35.0851 Class(1) f(2) Mid value…
Q: 云2 * 00 < CO T R 20 Question 38 The boxplot below shows salaries for Construction workers and…
A: Boxplot: The box plot represents the statistical data based on the five number summary, minimum,…
Q: The given data represent the number of people from a town, aged 25-64, who subscribe to a certain…
A: Enter the data in Excel.
Q: Compute this measure of central tendency and explain what this means in everyday language. The…
A: Solution
Q: 1. The following data represents the max temperature in Fahrenheit for 50 town. Convert these data…
A: We have to draw histogram, frequency polygon and ogive
Q: 1. Draw a frequency polygon corresponding to the ogive curve given below. 100 90 80 70 60 50 40 30…
A: An ogive or a cumulative frequency polygon is drawn using the values in the x-axis with their…

Step by step
Solved in 2 steps with 1 images


- We have a sample of 103 observations, which range in value from 25 to 67. Which of the following proposals would allow us to obtain a frequency data for the data? a) 5 classes of width 8 with maximum value 70 b) 5 classes of width 8 with maximum value 67 c) 6 classes of width 7, with minimum value 25 d) 6 classes of width 7, with minimum value 20In a frequency distribution table if the last class interval is 18– 34, then the class size will be: a. 10b. 7c. 8d. 91. Create the frequency table of the data.
- The following is a sample of prices, rounded to the nearest cent, charged per gallon of standard unleaded gasoline in the San Francisco Bay area in June 1997. 3.88, 3.90, 3.93, 3.90, 3.93, 3.96, 3.88, 3.94, 3.96, 3.88, 3.94, 3.99, 3.98 Represent these data in (a) a frequency table; (b) a relative frequency line graph.2) A researcher is interested in studying if male smokers and female smokers smoke a different number of cigarettes each day. She takes a sample of 10 male smokers and 10 female smokers from a nearby motorcycle club by asking the first 10 smokers of each gender she encountered. Their results are recorded below. Male 18 25 30 16 24 32 15 27 19 15 Female 12 15 36 30 12 18 34 22 10 12 Answer the following: a. Create appropriate graph(s) that can be used to compare the samples. Using the graph(s) to explain: does it appear that the number of cigarettes smoked by each gender are different? b. To run a formal test, which test will you run and which distribution will you use? Explain why for each. Are there any concerns you have about using the results of this test? c. Write the following hypothesis in symbols: Null Hypothesis: The average number of cigarettes smoked by male and female smokers is the same. H0: ________________________…2.3 The National Safety Council reports the following age breakdown for licensed drivers in the United States. Source: Bureau of the Census, Statistical Abstract of the United States 2009, p. 682. Age (Years) Licensed Drivers (Millions) Under 20 10.72 20–under 25 16.84 25–under 35 40.78 35–under 45 45.59 45–under 55 36.70 55–under 65 23.32 65 or over 28.76 Identify the following for the 35–under 45 classes: (a) Frequency (b) upper and lower limits (c) width and (d) midpoint.
- Consider the following frequency table representing the distribution of hours students study for an exam in a week. Hours Students Study for an Exam in a Week Class Frequency 8–16 12 17–25 11 26–34 11 35–43 9 44–52 13 Copy Data Step 1 of 2 : Determine the lower class boundary for the fifth class.(a) The following are the marks of the Statistics subject obtained by 40 students in a final examination. Develop a frequency table, use 4 as lower limit of the first class. 63 20 10 25 5 35 30 65 15 41 51 15 30 55 60 45 50 8 10 40 20 30 34 4 25 56 48 9 16 44 70 24 7 9 36 30 30 40 65 50 Construct a frequency distribution table using the Sturge’s rule.