Satterplot A Scatterplot B Scatterp Bacteria Growth Bacteria Growth Bacteria C 600 7.0 7.0 500 6.0 6.0 400 5.0 5.0 300 4.0 4.0 200 3.0 3.0 100 2.0 2.0 0 2 46 8 10 12 14 16 18 20 22 24 26 28 30 1.0 0 24 6 8 10 12 14 16 18 20 22 24 26 28 30 1.0 00 04 0.8 12 1.6 Number of Bacteria In (Number of Bacteria) In (Number of Bacteria)
Satterplot A Scatterplot B Scatterp Bacteria Growth Bacteria Growth Bacteria C 600 7.0 7.0 500 6.0 6.0 400 5.0 5.0 300 4.0 4.0 200 3.0 3.0 100 2.0 2.0 0 2 46 8 10 12 14 16 18 20 22 24 26 28 30 1.0 0 24 6 8 10 12 14 16 18 20 22 24 26 28 30 1.0 00 04 0.8 12 1.6 Number of Bacteria In (Number of Bacteria) In (Number of Bacteria)

Linear Algebra: A Modern Introduction
4th Edition
ISBN:9781285463247
Author:David Poole
Publisher:David Poole
Chapter4: Eigenvalues And Eigenvectors
Section4.6: Applications And The Perron-frobenius Theorem
Problem 22EQ

Related questions
Question
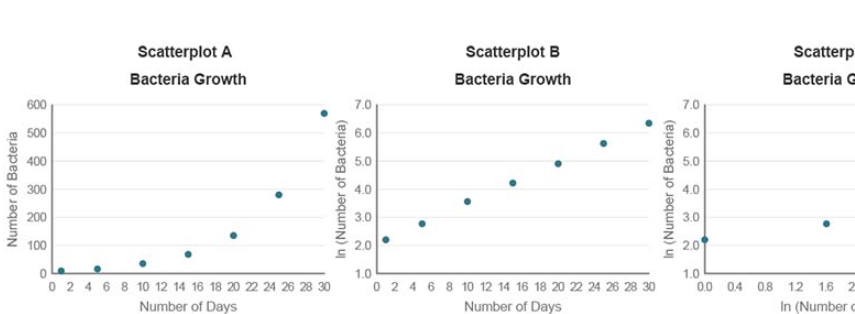
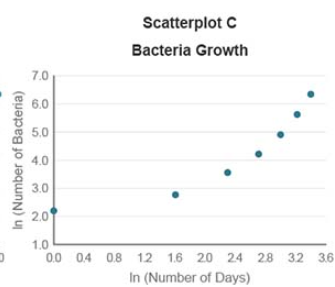
Bacteria growth was measured over a one-month period. Scatterplot A displays the number of cells measured over the recorded number of days. Two transformations of the data are shown in the next two graphs. Scatterplot B displays the relationship between the number of days and the natural log of the number of cells of bacteria. Scatterplot C displays the relationship between the natural log of the number of days and the natural log of the number of cells of bacteria.
Which model best represents the relationship between the number of days and the number of cells of bacteria?
A linear model would best represent the relationship because scatterplot A is fairly linear.
An exponential model would best represent the relationship because scatterplot B is fairly linear.
A linear model would best represent the relationship because scatterplot B is fairly linear.
A power model would best represent the relationship because scatterplot C is fairly linear.
Transcribed Image Text:Scatterplot A
Scatterplot B
Scatterp
Bacteria Growth
Bacteria Growth
Bacteria G
600
7.0
7.0
500
6.0
6.0
400
5.0
5.0
300
4.0
4.0
200
3.0
3.0
100
2.0
2.0
0 2 4 6 8 10 12 14 16 18 20 22 24 26 28 30
1.0
0 24 6 8 10 12 14 16 18 20 22 24 26 28 30
1.0
00
0.4 0.8
12
1.6 2
Number of Days
Number of Days
In (Number c
Number of Bacteria
In (Number of Bacteria)
In (Number of Bacteria)
Transcribed Image Text:Scatterplot C
Bacteria Growth
7.0
6.0
5.0
4.0
3.0
2.0
1.0
0.0 04 0.8 12 1.6 20 24 28 32 3.6
In (Number of Days)
In (Number of Bacteria)
Expert Solution
This question has been solved!
Explore an expertly crafted, step-by-step solution for a thorough understanding of key concepts.

This is a popular solution!

Trending now
This is a popular solution!

Step by step
Solved in 2 steps

Recommended textbooks for you
Linear Algebra: A Modern Introduction
Algebra
ISBN:
9781285463247
Author:
David Poole
Publisher:
Cengage Learning

Functions and Change: A Modeling Approach to Coll…
Algebra
ISBN:
9781337111348
Author:
Bruce Crauder, Benny Evans, Alan Noell
Publisher:
Cengage Learning
Linear Algebra: A Modern Introduction
Algebra
ISBN:
9781285463247
Author:
David Poole
Publisher:
Cengage Learning
Functions and Change: A Modeling Approach to Coll…
Algebra
ISBN:
9781337111348
Author:
Bruce Crauder, Benny Evans, Alan Noell
Publisher:
Cengage Learning