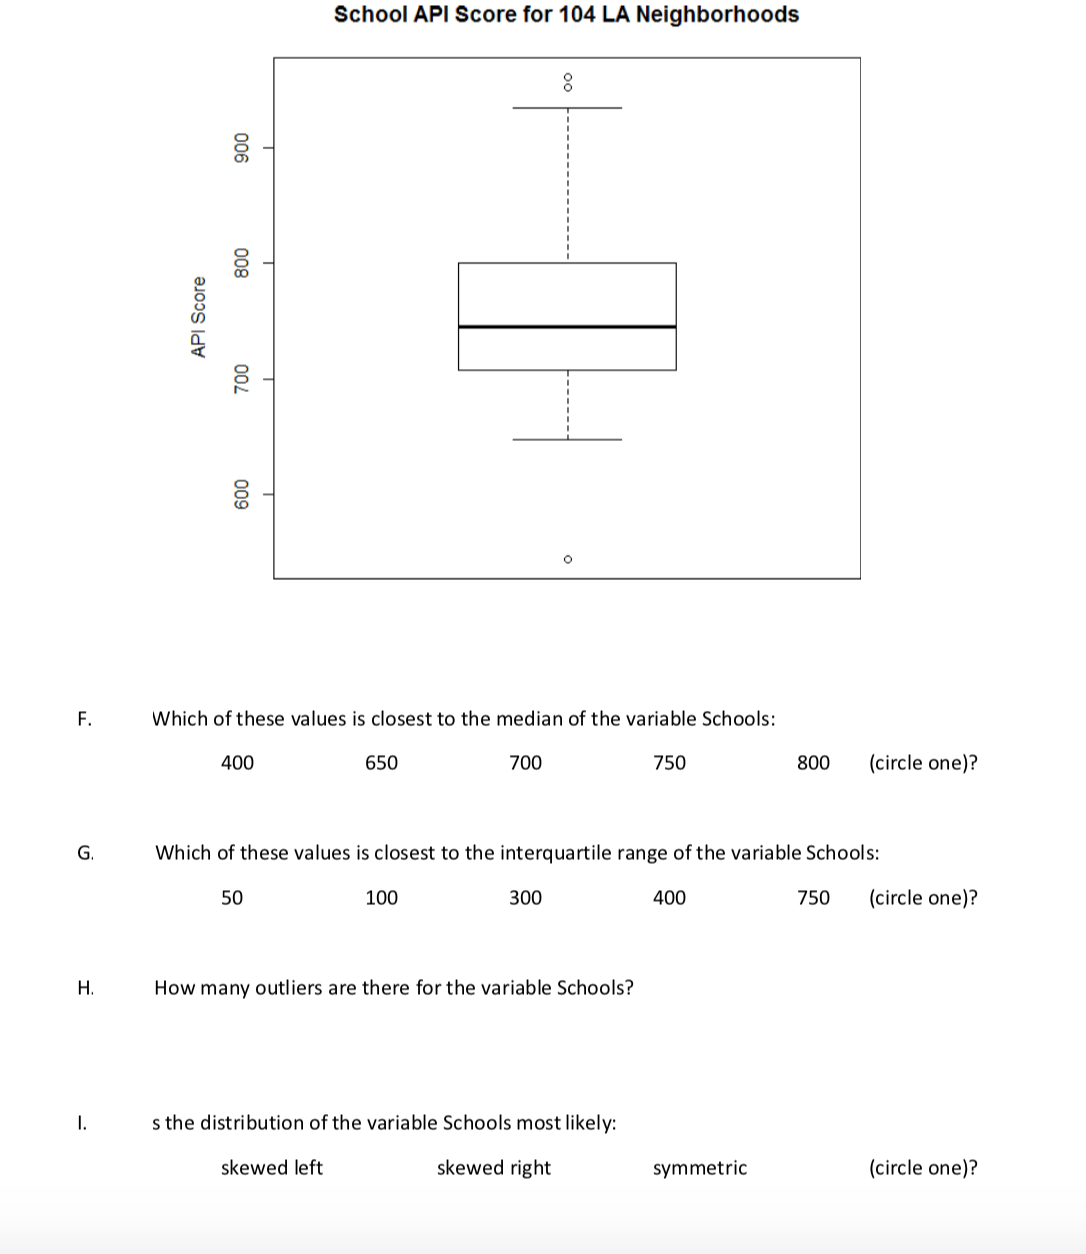
School API Score for 104 LA Neighborhoods Which of these values is closest to the median of the variable Schools: 400 800 (circle one)? 650 700 750 Which of these values is closest to the interquartile range of the variable Schools: 100 300 400 50 750 (circle one)? How many outliers are there for the variable Schools? s the distribution of the variable Schools most likely: (circle one)? skewed left skewed right symmetric


Hello there! There are more than three sub parts in the question. According to our policies cannot answer more than three sub parts. Do find the solutions to parts F, G and H. If you have any doubt in remaining part please make a new request mentioning the questions you need help in.
Given a box plot for school API score for 104 LA Neighborhoods as shown below.
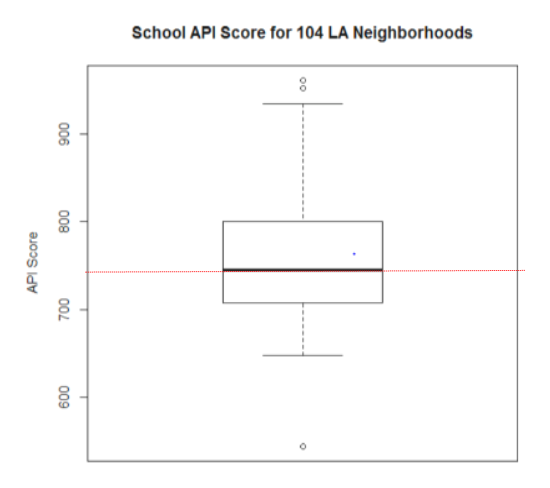
From the Box plot above the dark line in between the box represents the second quartile which is known as Median.
So we draw a line on the line representing median it intersects the number line at approximately mid point of 700 and 800. So we can say it will be 750 approximately.
So the value close to the median of the school variable = 750.
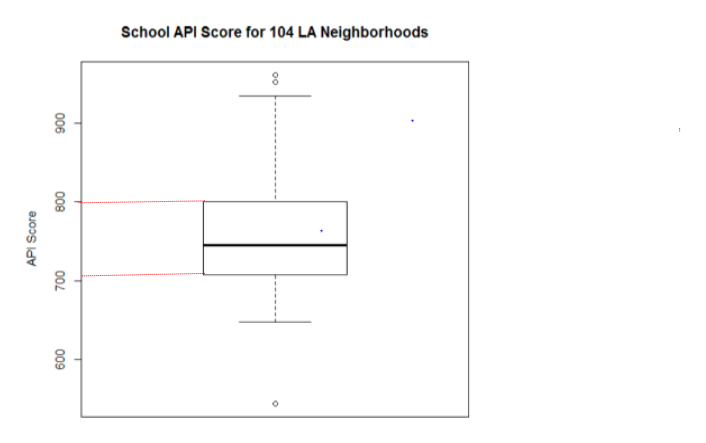
Inter quartile Range = Q3 - Q1
from the box plot Q3 = 800, Q1 = 700
IQR = 800-700 = 100.
The value closest to interquartile range of school variables = 100.

Step by step
Solved in 3 steps with 3 images


