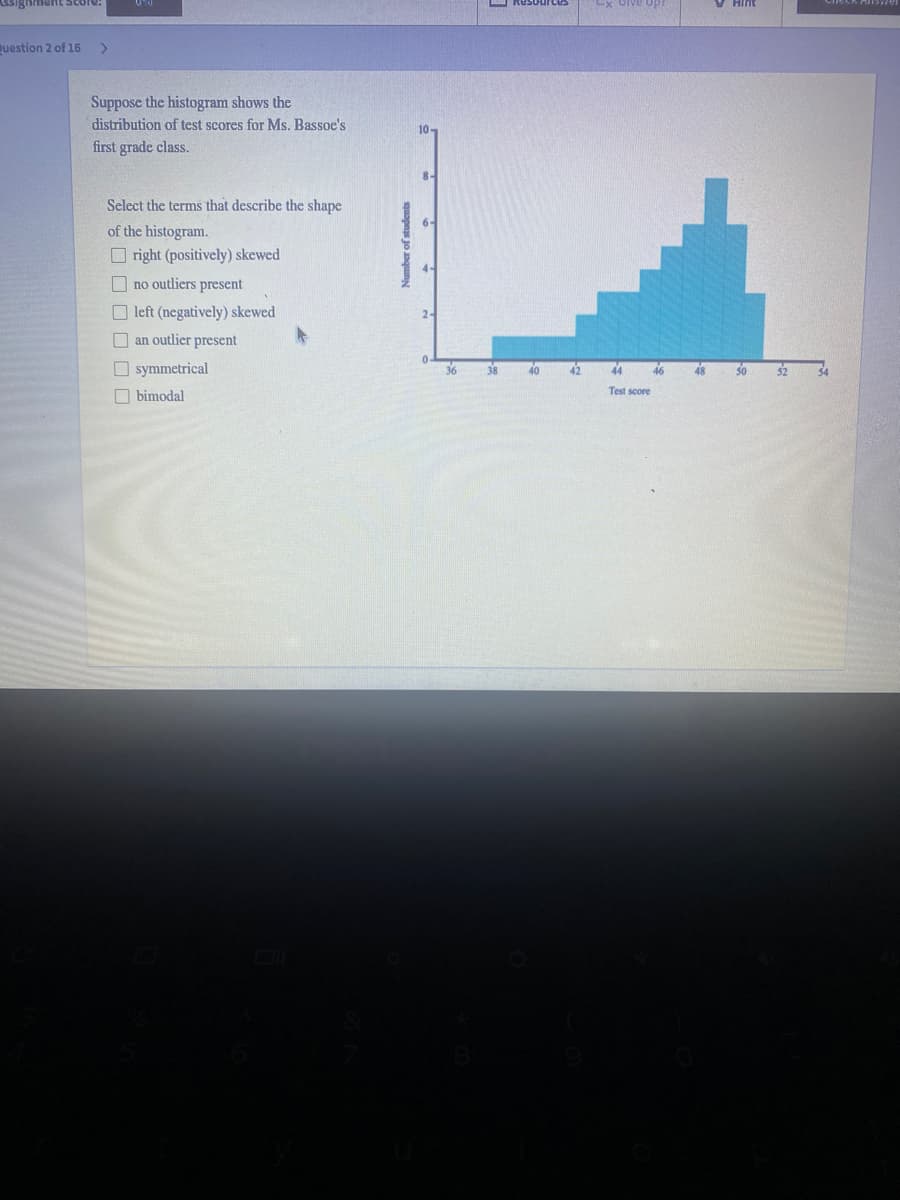
Suppose the histogram shows the distribution of test scores for Ms. Bassoe's 10 first grade class. 8- Select the terms that describe the shape of the histogram. O right (positively) skewed O no outliers present O left (negatively) skewed 2- O an outlier present O symmetrical 36 bimodal Number of students
Q: A study is undertaken to investigate the self-reported health status among women with osteoporosis.…
A:
Q: Imagine a researcher wants to determine whether parents differ from each other in their fondness for…
A: Explanation: It is given that research asks each parent of 50 couples, It means, there are 50…
Q: A survery was taken of 125 fans. They were asked what was the most expensive ticket you ever bought…
A: Given data, Minimum = 25 Q1 = 95 Q2 = 110 Q3 = 135 Maximum = 175
Q: D. What is the IQR of the data E. What is the median of the data F. Are there any outliers? If…
A: Given data is in terms of percentage. Convert the data values in decimals by dividing by 100. Data:…
Q: Suppose that 50 measurements were taken and the mean was calculated to be 4.55. Assume next that…
A: Solution: From the given information, mean of 50 measurements is 4.55.
Q: 5. Which of the following are valid ways to identify outliers? Select all that apply. a. Use the 1.5…
A: Valid ways to find outliers : We know that Outlier : It is an abnormal value in the data set ,…
Q: 4. A research survey of about 13,900 incoming freshmen in American universities and colleges found…
A: Scatter plot is the graphical representation of two numeric values on the Cartesian plane which…
Q: Twelve students were asked to measure their pulses for 30 seconds and multiply by two to get their…
A: A boxplot is a data visualization plot that tells us whether the data set is symmetric or not. In a…
Q: the sticker prices ( in dollars) of 11 vehicles at a car dealership are listed 39144, 40872,…
A: Given information- We have given the sticker prices (in dollars) of 11 vehicles at a car dealership.…
Q: For a box plot, here are 4 values at the low end of a dataset and 4 values near the high end of a…
A: Given: Data 2.7 5.5 6 9 … 50.5 54 60 65 Value 5 & 47
Q: Here are the scores of 17 students on an algebra test. 56, 57, 62, 62, 63, 66, 66, 69, 71, 72, 73,…
A: Concept: Box and Whisker Plots: An illustration of data from a five-number summary that includes one…
Q: | Nikko compares the prices of a skateboard at 7 different online stores. His data is shown below.…
A:
Q: Q4. Consider the following data {5, 6, 16, 18, 17, 17, 16, 18, 33, 20, 20, 30, 19, 34}, how many…
A:
Q: oes the size of a sample influence the shape of the distribution?
A: A sample is drawn randomly from a population to draw some inferences about the population. It is not…
Q: To earn full credit for this question, use your own sheet of paper to solve the problem, showing all…
A:
Q: Find the mean and median and outliers.
A:
Q: The following table lists the average temperature in New Haven from 1930 to 1955: 51.5 52.8 51.8…
A: Given the table lists the average temperature in New Heaven from 1930 and 1955 Find the first…
Q: Use the following data set: 13, 8, 10, 7, 13, 9,7, 11, 12, 10, 13 to answer questions The outlier is…
A: Here we need to choose from the correct option. We need to check whether there is extreme values in…
Q: For a box plot, here are 4 values at the low end of a dataset and 4 values at the high end of a set…
A: Whiskers represents the minimum and maximum value of the data set and are drawn from first and third…
Q: set
A:
Q: Solve the following problem. Show your complete solution. 3. Miss Mathica Kumpleto (MMK), a SHS Math…
A: The process of selecting a sample from a population is called sampling. In sampling a representative…
Q: • Which of the following measures is not sensitive to outliers (B) median (A) mean (C) range (D)…
A: Need to find which of the given measures is not sensitive to outliers. Mode is not sensitive to…
Q: Imagine a researcher wants to determine whether the participants in his sample are skewed toward…
A: Introduction: When the mean of one group is to be compared to a fixed value, or the means of two…
Q: The accompanying table lists the numbers of words spoken in a day by each member of 56 different…
A: Null and alternative hypothesis is given by- H0:μd=0Ha:μd<0Level of significance=0.05 For the…
Q: Which of the three measurements, mean, median, or mode, is the most influenced by an outlier value…
A: Outlier in a data set is the value which is much higher than or lower than almost all other values.…
Q: each 26. The followving box plot shows the number of daily newspapers published in state and the…
A: Given box-plot is:
Q: Compute the upper fence for the class height data (so that if any heights are above this value, they…
A: We know, Inter quartile range (IQR) = Q3 -Q1 Upper fence = Q3+1.5*IQR Five number summary…
Q: In your own words, describe to someone who knows only a little statistics how to recognize when an…
A: In statistics, three measures of central tendency are widely used. These three measures are also…
Q: An insurance company crashed four cars of the same model at 5 miles per hour. The costs of repair…
A: Given problem Given that
Q: Determine whether the following statement is true or false. If it is false, rewrite it as a true…
A: Outlier: The outlier is an observation which is very far from the other observations.
Q: Construct a histogram displaying your data. In complete sentences, describe the shape of your…
A: Given the histogram and box plot of the data. Using these graphs we have to write does the middle…
Q: A researcher asks a sample of brothers and sisters to rate how positive their family environment was…
A: Design of experiment is a branch of statistics. This basically deals with the planning, conducting…
Q: A survey taken in a large statistics class contained the question: "What's the fastest you have…
A: Answer : No
Q: For a box plot, here are 4 values at the low end of a dataset and 4 values near the high end of a…
A:
Q: Q4. Consider the following data (16, 7, 5, 16, 17, 17, 18, 20, 19, 20, 18, 32, 31, 30), how many…
A: Outliers: Any values in the data set below Q1-1.5×IQR and above Q3+1.5×IQR are considered as…
Q: What are the potential outliers given that Q1 = 6, Q2 = 13, Q3 = 22, and the IQR = 16
A: Given :- Q1 = 6, Q2 = 13, Q3 = 22, and the IQR = 16 we have to find the potential outliers.…
Q: Find the mean of the sampling distribution of p̂.
A: The population proportion is 0.16, and sample size is 400 patients.
Q: Use the data in the table above to make a stem-and-leaf display for milligrams of carbon monoxide…
A: plot stem and leaf
Q: An insurance company crashed four cars of the same model at 5 miles per hour. The costs of repair…
A: Given data is$423 , $404 , $486 , $222
Q: Are cigarettes bad for people? Cigarette smoking involves tar, carbon monoxide, and nicotine…
A: To create stem and Leaf plot for the given data, we arrange the data in ascending order so that…
Q: A data sample has a mean of 107, a median of 122 and a mode of 134. The distribution of the data is…
A: Skewness of a distribution
Q: In a survey, 10 people gave the following ratings for a local politician (on a scale of 0 to 100).…
A: Outliers are those data points which do not depict the general behaviour of the data set.
Q: A survey taken in a large statistics class contained the question: "What's the fastest you have…
A: We have given that the five number summary, Min = 55 , Q1 = 95 , Median = 110 , Q3 = 120 , Max =…
Q: as one variable decreases, the other variable increases as one variable decreases, the other…
A: We have given that, A correlation coefficient of 0.05 means that? We have to check the correct…
Q: The registrar’s office at ACC predicts that 90% of the 6,950 spaces open in various math classes…
A:
Q: A set includes the following five numbers: 20,19,50,18,16 which data measure decreases when the…
A: The set is the collection of real numbers, given as
Q: For a box plot, here are 4 values at the low end of a dataset and 4 values near the high end of a…
A: The data values which are less than the lower fence or greater than the upper fence are called…
Q: 34. The following box plot shows the number of daily nowspapers published in each state and the…
A:
Q: To earn full credit for this question, use your own sheet of paper to solve the problem, showing all…
A: All the answer are given
Q: a. Find P22, which is the score separating the bottom 22% scores from the top 78% scores. P22 (for…
A:
Trending now
This is a popular solution!
Step by step
Solved in 2 steps
- Han Samples are collected from the River X and pH values are observed. 9 different pH values are listed in table 3. Table 3 Concentrations 4.2 3.8 6.0 3.5 8.1 4.9 4.1 3.2 4.0Draw box plot and find a. Bowley’s coefficient of skewness b. Karl Pearson’s coefficient of skewness c. Third momentA medical researcher randomly assigns 100 high-risk heart patients into two groups. One group will get open heart surgery and the other groups will get a transcatheter aortic valve replacement. She will compare the two groups to see how long they live after their procedures. What statistical test should she use to analyze the data? a. Chi Square Goodness of Fit Test b. Correlation c. One sample t-test d. Independent Samples t-test e. Factorial ANOVATen pregnant women were given an injection of Pitocin to induce labor.Their systolic blood pressures immediately before and after the injection were taken and define the paired differences to be "after - before". The following table shows the summary statistics. Use a 0.05 level ofsignificance. Intermediate CalculationsSample Size 10d-bar 3.1000SD 4.2019 The computed value of the test statistic is (final answer to 3 decimal places)Do the data provide sufficient evidence that injection of this drug changes blood pressure? (choose from Yes or No)
- Samples are collected from the River X and pH values are observed. 9 different pH values are listed in table 3. Table 3 Concentrations 3.55 4.01 5.38 3.22 8.05 5.25 4.67 3.67 3.5Draw box plot and find a. Bowley’s coefficient of skewness b. Karl Pearson’s coefficient of skewness c. Third moment Rubric Stages of Process Marks Imagine and Plan 2Composition 2Effort 1A researcher wants to examine the relationship between time spend on social media (variable X) and loneliness (variable Y) in young adults. A randomly sample of n = 52 young adults was asked how much time in average they spend on social media each day and how lonely day feel on a typical day. The partial computations of collected data produced the following results: SP = -14 MX = 10 SSx = 36 MY = 16 SSY = 49 A. Based on these results, is there a significant correlation between time spend on social media and loneliness among young adults? Use a Pearson correlation test with p < .05, 2-tails to answer this research question. Follow the steps of hypothesis testing and insert your answers below. In your calculations,round all numbers to two decimal places to avoid rounding errors. ANSWER H0: H1: Computed Pearson r = df for decision about H0: Critical r-value used for decision about H0: Decision about H0 (i.e., reject or fail to…Q2. A fast-food chain decided to carry out an experiment to assess the influence of advertising expenditure on sales. Different relative changes in advertising expenditure, compared to the previous year, were made in eight regions of the country, and resulting changes in sales levels were observed the accompanying table shows the results. Increase in advertising expenditure (%) 0 5 15 20 25 30 35 40 Increase in sales (%) 5 10 18 25 35 50 60 65 Determine the value of ∑X, ∑X2, ∑Y, ∑Y2, ∑XY. Where X represent independent variable and Y for dependent variable. [2] Determine and interpret the coefficient of correlation between the two variables. [1] Determine the value of regressions coefficients and write down the simple linear regression
- Q2. A fast-food chain decided to carry out an experiment to assess the influence of advertising expenditure on sales. Different relative changes in advertising expenditure, compared to the previous year, were made in eight regions of the country, and resulting changes in sales levels were observed the accompanying table shows the results. Increase in advertising expenditure (%) 0 5 15 20 25 30 35 40 Increase in sales (%) 5 10 18 25 35 50 60 65 Determine the value of ∑X, ∑X2, ∑Y, ∑Y2, ∑XY. Where X represent independent variable and Y for dependent variable. Determine and interpret the coefficient of correlation between the two variables. Determine the value of regressions coefficients and write down the simple linear regression model. Test the validity of the…An article contained the following observations on degree of polymerization for paper specimens for which viscosity times concentration fell in a certain middle range: 418 420 422 422 425 428 431 434 437 438 445 446 449 451 458 462 465 (a) Construct a boxplot of the data. Comment on any interesting features. (Select all that apply.) The data appears to be centered near 438.There are no outliers.The data is strongly skewed.There is little or no skew.The data appears to be centered near 428.There is one outlier. (b) Is it plausible that the given sample observations were selected from a normal distribution? YesNo (c) Calculate a two-sided 95% confidence interval for true average degree of polymerization. (Round your answers to two decimal places.) , Does the interval suggest that 445 is a plausible value for true average degree of polymerization? YesNo Does the interval suggest that 456 is a plausible value? YesNo You…Data for two variables, x and y, follow. xi 22 24 26 28 40 yi 17 26 36 40 75 Compute the studentized deleted residuals for these data. (Round your answers to two decimal places.) xi yi StudentizedDeleted Residual 22 17 -1.94 24 26 -.12 26 36 1.79 28 40 40 75 #2)At the 0.05 level of significance, can any of these observations be classified as an outlier? Explain. (Select all that apply.) A) Observation xi = 22 can be classified as an outlier since it has a large studentized deleted residual (greater than t0.025 or less than −t0.025). B) Observation xi = 24 can be classified as an outlier since it has a large studentized deleted residual (greater than t0.025 or less than −t0.025). C) Observation xi = 26 can be classified as an outlier since it has a large studentized deleted residual (greater than t0.025 or less than −t0.025). D) Observation xi = 28 can be classified as an outlier since it has a large studentized deleted residual (greater than…
- LEDs and CFLs. Light-emitting diodes (LEDs) and compact fluorescent lights (CFLs) are lightbulbs that are supposed to last up to fifty times longer than old fashioned incandescent lightbulbs and also use less energy. Consumer Reports sampled eighteen different 60-watt LED and CFL lightbulbs. The following table lists their brightness, in lumens. Use the technology of your choice to decide whether applying the z-interval procedure to these data is reasonable. Explain youranswer. 900 690 910 745 765 820 700 360 925 805 850 730 6865 680 750 735 86516) You wish to use a Kruskal-Wallis Test to determine if median height of anundergraduate student depends on class standing (Freshman, Sophomore, Junior orSenior) at a =0.05. The sample data (Student Height worksheet) consists of heightvalues for 8 students from each class for a total of 32. What is the critical value for thehypothesis test?A) 44.99B) 15.51C) 14.07D) 9.488E) 7.815Using a long rod that has length m, you are goingto lay out a square plot in which the length of eachside is m. Thus the area of the plot will be m2.However, you do not know the value of m, soyou decide to make n independent measurementsX1, X2,... Xn of the length. Assume that each Xihas mean m (unbiased measurements) and variance s2.a. Show that X2 is not an unbiased estimatorfor m2. [Hint: For any rv Y, E(Y2) ¼V(Y) + [E(Y)]2. Apply this with Y ¼ X.]b. For what value of k is the estimator X2 - kS2unbiased for m2? [Hint: Compute E(X2 - kS2).]