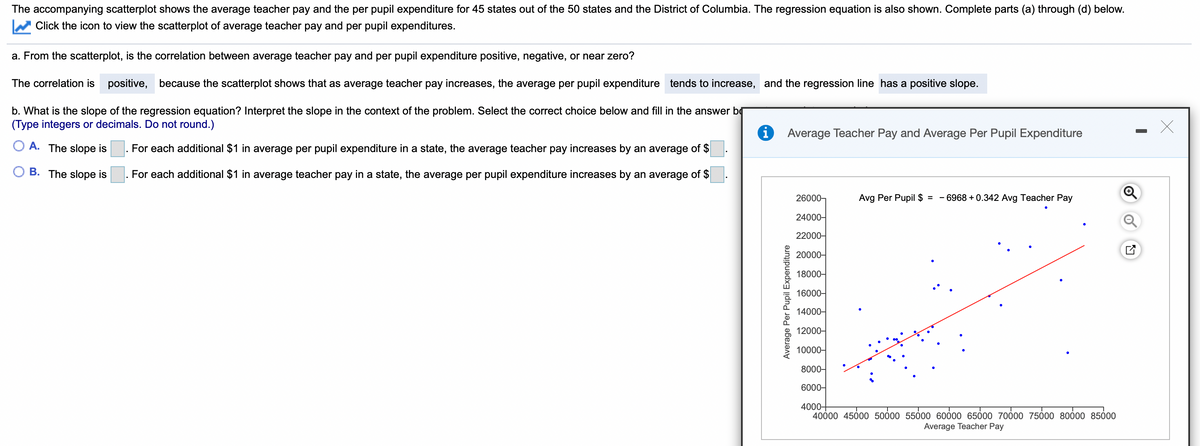
n Click the icon o view the scatterplot of average teacher pay and per pupil expenditures. From the scatterplot, is the correlation between average teacher pay and per pupil expenditure positive, negative, or near zero? he correlation is positive, because the scatterplot shows that as average teacher pay increases, the average per pupil expenditure tends to increase, and the regression line has a positive slope. What is the slope of the regression equation? Interpret the slope in the context of the problem. Select the correct choice below and fill in the answer be Type integers or decimals. Do not round.) O Average Teacher Pay and Average Per Pupil Expenditure DA. The slope is For each additional $1 in average per pupil expenditure in a state, the average teacher pay increases by an average of $. OB. The slope is For each additional $1 in average teacher pay in a state, the average per pupil expenditure increases by an average of $. 26000- Avg Per Pupil $ = - 6968 +0.342 Avg Teacher Pay 24000- 22000- 20000- 18000- 16000- 14000- 12000- 10000- 8000- 6000- 4000- 40000 4500 50000 5500 60600 6500 70600 7500 80000 8500 Average Teacher Pay Average Per Pupil Expenditure

Algebra and Trigonometry (MindTap Course List)
4th Edition
ISBN:9781305071742
Author:James Stewart, Lothar Redlin, Saleem Watson
Publisher:James Stewart, Lothar Redlin, Saleem Watson
Chapter1: Equations And Graphs
Section1.FOM: Focus On Modeling: Fitting Lines To Data
Problem 12P: Demand for Candy Bars In this problem you will determine a linear demand equation that describes the...
icon
Related questions
icon
Concept explainers
Question
The accompanying scatterplot shows the average teacher pay and the per pupil expenditure for 45 states out of the 50 states and the District of Columbia. The regression equation is also shown. Complete parts (a) through (d) below.
Click the icon to view the scatterplot of average teacher pay and per pupil expenditures.
a. From the scatterplot, is the correlation between average teacher pay and per pupil expenditure positive, negative, or near zero?
The correlation is positive, because the scatterplot shows that as average teacher pay increases, the average per pupil expenditure tends to increase, and the regression line has a positive slope.
b. What is the slope of the regression equation? Interpret the slope in the context of the problem. Select the correct choice below and fill in the answer bg
(Type integers or decimals. Do not round.)
Average Teacher Pay and Average Per Pupil Expenditure
O A. The slope is
For each additional $1 in average per pupil expenditure in a state, the average teacher pay increases by an average of $
O B. The slope is
. For each additional $1 in average teacher pay in a state, the average per pupil expenditure increases by an average of $
26000,
Avg Per Pupil $ =
6968 + 0.342 Avg Teacher Pay
24000-
22000-
20000-
18000-
16000-
14000-
12000-
10000-
8000-
6000-
4000+
40000 45000 50000 55000 60000 6500 70000 7500 80000 85000
Average Teacher Pay
Average Per Pupil Expenditure
Transcribed Image Text:The accompanying scatterplot shows the average teacher pay and the per pupil expenditure for 45 states out of the 50 states and the District of Columbia. The regression equation is also shown. Complete parts (a) through (d) below. Click the icon to view the scatterplot of average teacher pay and per pupil expenditures. a. From the scatterplot, is the correlation between average teacher pay and per pupil expenditure positive, negative, or near zero? The correlation is positive, because the scatterplot shows that as average teacher pay increases, the average per pupil expenditure tends to increase, and the regression line has a positive slope. b. What is the slope of the regression equation? Interpret the slope in the context of the problem. Select the correct choice below and fill in the answer bg (Type integers or decimals. Do not round.) Average Teacher Pay and Average Per Pupil Expenditure O A. The slope is For each additional $1 in average per pupil expenditure in a state, the average teacher pay increases by an average of $ O B. The slope is . For each additional $1 in average teacher pay in a state, the average per pupil expenditure increases by an average of $ 26000, Avg Per Pupil $ = 6968 + 0.342 Avg Teacher Pay 24000- 22000- 20000- 18000- 16000- 14000- 12000- 10000- 8000- 6000- 4000+ 40000 45000 50000 55000 60000 6500 70000 7500 80000 85000 Average Teacher Pay Average Per Pupil Expenditure
Expert Solution
trending now

Trending now

This is a popular solution!

steps

Step by step

Solved in 2 steps

Blurred answer
Knowledge Booster
Correlation, Regression, and Association
Learn more about
Need a deep-dive on the concept behind this application? Look no further. Learn more about this topic, statistics and related others by exploring similar questions and additional content below.
Similar questions
Recommended textbooks for you
Algebra and Trigonometry (MindTap Course List)
Algebra
ISBN:
9781305071742
Author:
James Stewart, Lothar Redlin, Saleem Watson
Publisher:
Cengage Learning
Functions and Change: A Modeling Approach to Coll…
Algebra
ISBN:
9781337111348
Author:
Bruce Crauder, Benny Evans, Alan Noell
Publisher:
Cengage Learning
College Algebra
College Algebra
Algebra
ISBN:
9781305115545
Author:
James Stewart, Lothar Redlin, Saleem Watson
Publisher:
Cengage Learning
College Algebra (MindTap Course List)
Algebra
ISBN:
9781305652231
Author:
R. David Gustafson, Jeff Hughes
Publisher:
Cengage Learning
Glencoe Algebra 1, Student Edition, 9780079039897…
Algebra
ISBN:
9780079039897
Author:
Carter
Publisher:
McGraw Hill
College Algebra
College Algebra
Algebra
ISBN:
9781337282291
Author:
Ron Larson
Publisher:
Cengage Learning