shape of distribution and significance

MATLAB: An Introduction with Applications
6th Edition
ISBN:9781119256830
Author:Amos Gilat
Publisher:Amos Gilat
Chapter1: Starting With Matlab
Section: Chapter Questions
Problem 1P

Related questions
Topic Video
Question
100%
Can someone please help me out with these questions.
![QUESTION 17
shape of distribution and significance
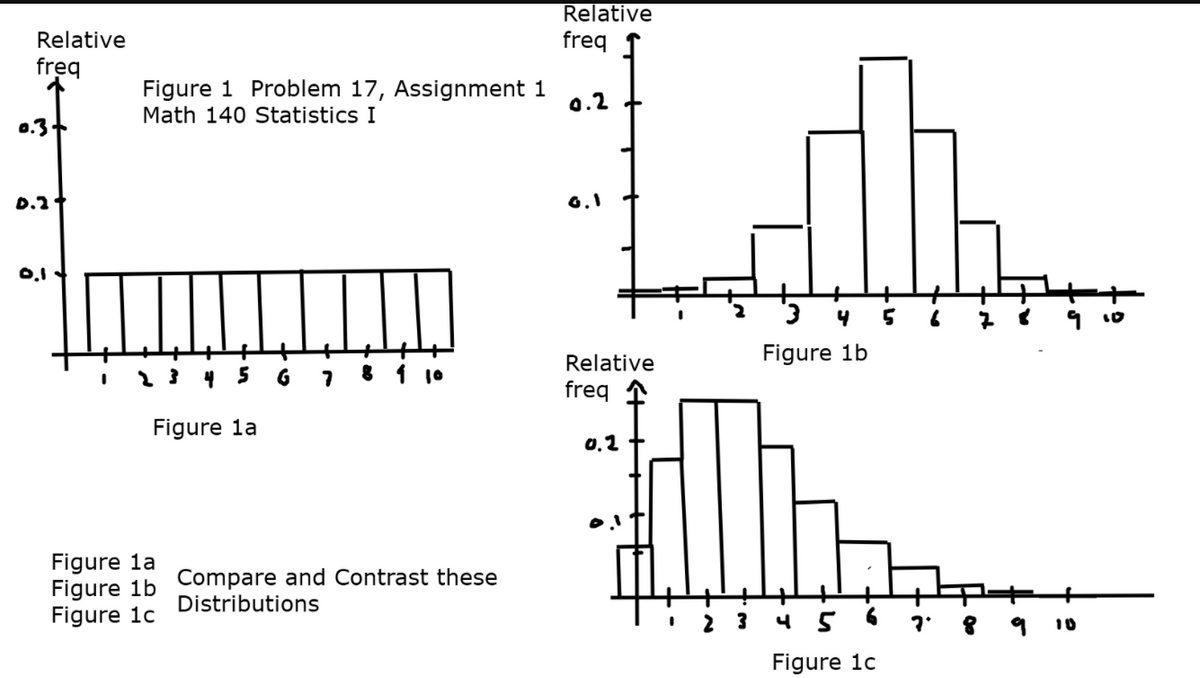
See [Figure 1] of the Additional Documents for Assignment 1 for graphical representations of the distributions in this problem.
This contains three distributions as frequency histograms in Figure 1a, Figure 1b, and Figure 1c.
Observe similarities and differences between each of these distributions.
Address issues such as symmetry or non-symmetry (skewed in one direction),
and whether the data is even spread, clustered toward the center, or clustered toward the edges.
Can you guess where the center of the data is for each set of data?](/v2/_next/image?url=https%3A%2F%2Fcontent.bartleby.com%2Fqna-images%2Fquestion%2Fce859fa4-e941-4e1a-9196-dfd477b8947b%2F2e42cbb5-2094-4014-8808-a6fef100de48%2Fxqza4q2_processed.png&w=3840&q=75)
Transcribed Image Text:QUESTION 17
shape of distribution and significance
See [Figure 1] of the Additional Documents for Assignment 1 for graphical representations of the distributions in this problem.
This contains three distributions as frequency histograms in Figure 1a, Figure 1b, and Figure 1c.
Observe similarities and differences between each of these distributions.
Address issues such as symmetry or non-symmetry (skewed in one direction),
and whether the data is even spread, clustered toward the center, or clustered toward the edges.
Can you guess where the center of the data is for each set of data?
Transcribed Image Text:Relative
freq
Relative
freq
Figure 1 Problem 17, Assignment 1
Math 140 Statistics I
0.2
0.3
D.2°
6.1
Figure 1b
Relative
4 5
1 10
freq
Figure la
0,2
Figure la
Figure 1b Compare and Contrast these
Figure 1c
Distributions
2 3
8 9 10
Figure 1c
Expert Solution
This question has been solved!
Explore an expertly crafted, step-by-step solution for a thorough understanding of key concepts.

Step by step
Solved in 2 steps

Knowledge Booster


Learn more about
Need a deep-dive on the concept behind this application? Look no further. Learn more about this topic, statistics and related others by exploring similar questions and additional content below.Recommended textbooks for you
MATLAB: An Introduction with Applications
Statistics
ISBN:
9781119256830
Author:
Amos Gilat
Publisher:
John Wiley & Sons Inc

Probability and Statistics for Engineering and th…
Statistics
ISBN:
9781305251809
Author:
Jay L. Devore
Publisher:
Cengage Learning

Statistics for The Behavioral Sciences (MindTap C…
Statistics
ISBN:
9781305504912
Author:
Frederick J Gravetter, Larry B. Wallnau
Publisher:
Cengage Learning
MATLAB: An Introduction with Applications
Statistics
ISBN:
9781119256830
Author:
Amos Gilat
Publisher:
John Wiley & Sons Inc
Probability and Statistics for Engineering and th…
Statistics
ISBN:
9781305251809
Author:
Jay L. Devore
Publisher:
Cengage Learning
Statistics for The Behavioral Sciences (MindTap C…
Statistics
ISBN:
9781305504912
Author:
Frederick J Gravetter, Larry B. Wallnau
Publisher:
Cengage Learning

Elementary Statistics: Picturing the World (7th E…
Statistics
ISBN:
9780134683416
Author:
Ron Larson, Betsy Farber
Publisher:
PEARSON

The Basic Practice of Statistics
Statistics
ISBN:
9781319042578
Author:
David S. Moore, William I. Notz, Michael A. Fligner
Publisher:
W. H. Freeman

Introduction to the Practice of Statistics
Statistics
ISBN:
9781319013387
Author:
David S. Moore, George P. McCabe, Bruce A. Craig
Publisher:
W. H. Freeman