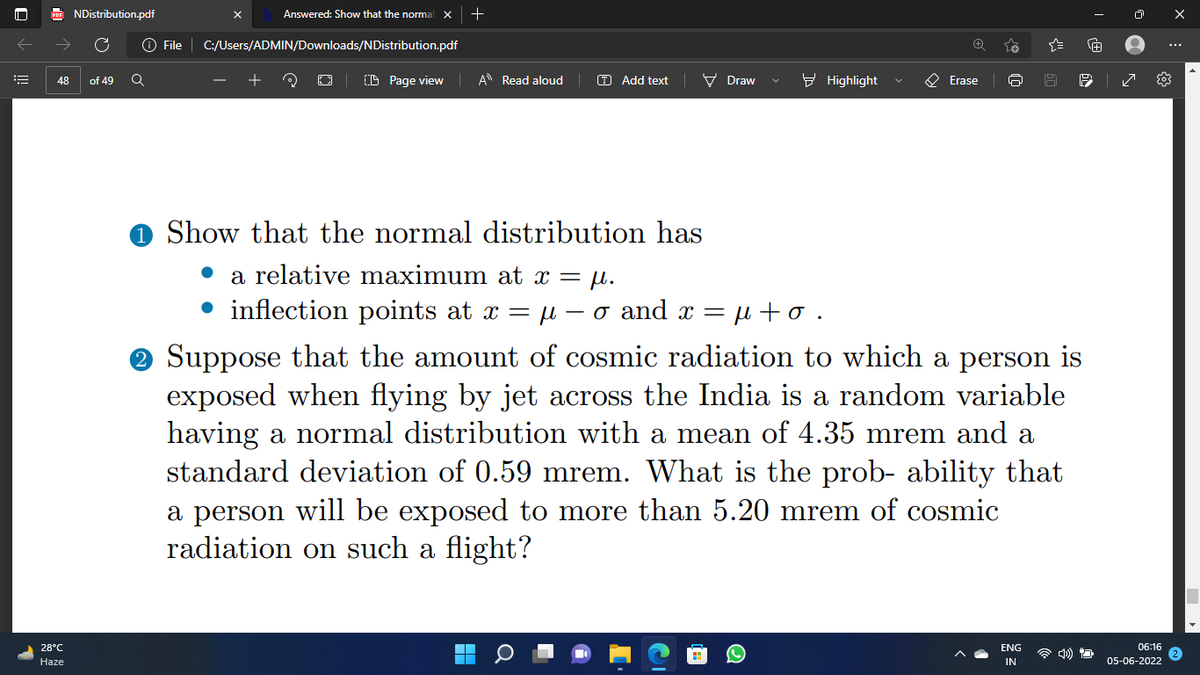
Show that the normal distribution has a relative maximum at x = p. inflection points at x = μ-o and x = μ+o.
Q: The following table shows the selling prices, in thousands of dollars, and the square footages of…
A: The given correlation coefficient is 0.545.
Q: The accompanying data gives the high and low temperatures in January for a random sample of 50…
A: The Pearson's correlation coefficient(r) formula is given by,
Q: hypothesis test is conducted at the 0.05 level of significance to test whether or not the population…
A:
Q: Based on the Nielsen ratings, the local CBS affiliate claims its 11 p.m. newscast reaches 49% of the…
A: Given: Hypothesized population proportion po= 49%=0.49 Sample size n=100 Sample proportion p=…
Q: Suppose you are doing a hypothesis test for a population proportion p, and we have: Ho: p = 59.25%…
A:
Q: USA Today reports that the average expenditure on Valentine's Day was expected to be $100.89. Do…
A: (a) Obtain the point estimate of the difference between the population mean expenditure for males…
Q: Why do phillips curves look different across different countries?
A: Reason- As we know the Phillips curves is define as the inverse relationship between the level of…
Q: Determine the mean and standard deviation of the variable X in each of the following binomial…
A: Here we have to find mean and standard deviation of binomial distribution Since we know that mean…
Q: The probability of a chocolate cake made by Chef Raisa being burnt is 5%. This year, she plans to…
A:
Q: Suppose you are doing a hypothesis test for a population proportion p, and we have: Ho: p=59.25% H₁:…
A:
Q: software system. In planning for the operating system that he will use, he needs to estimate the…
A: Given that Margin of error =E =5%=0.05
Q: For x, y = (0, ∞), let X and Y have the joint density f(x, y) = ¹²e-²-v. -е i) Compute the marginal…
A: Given that We have to find a... Marginal density function of Y b.. conditional mean and variance…
Q: peed (miles per hour) equency + 42-45 we mean of the frequency distribution is miles per hour ound…
A:
Q: Suppose we have the following simple linear regression (SLR) mode y = Bot Bi tu, E[u|x] = 0. To…
A: Given: sample average x x¯=3sample average y y¯=250Covariance between x and y cov(x,y)=20Standard…
Q: Suppose X₁, X2,... are i.i.d. with moment generating function Mx(t). Let N be a nonnegative…
A: X1, X2, .... are i.i.d. random variables with Moment Generating Function MX(t). N is non negative…
Q: Apply the graph from part (d) to estimate visually the cost of driving the car 150 miles. Then…
A:
Q: For one particular study, suppose a researcher found evidence that at least one of the four group…
A: Here given a evidence of group of means The researcher wishes to keep the probability of making at…
Q: (a) Suppose you collect a SRS of size n from a population and from the data collected you computed a…
A: Solution: We will discuss the relation between confidence level and width of the confidence…
Q: Consider the linear model Y₁ = B₁ + B₁X₁¡ + ß₂X2i + u; where u; is the error term and where E (u;…
A: 4 main assumptions of Gauss Markov multiple linear model are : Linearity : The errors and…
Q: The table below shows the total annual precipitation for San Diego, California. 1994 1995 1996 1997…
A: Given: sample size(n)=10 Data: Year Precip(in) x 1994 9.4 1995 17 1996 7.3 1997 7 1998…
Q: Xochitl is worried that this month’s Red Chile batch is not as spicy as last month’s. To help test…
A: We have to conduct the Dependent Two-Sample Test to test this hypothesis.
Q: The manager of a fast-food restaurant featuring hamburgers is adding salads to the menu. If they…
A: Given Make option fixed costm=14000 variable costm=$1 Buy option variable costb=$3…
Q: Consider the partially completed ANOVA summary table below. Complete parts a through d below. SS F…
A: Hey there! Thank you for posting the question. Since your question has more than 3 parts, we are…
Q: Identify the test statistic for this hypothesis test. The test statistic for this hypothesis test…
A: It is given that Favourable cases, X = 25 Sample size, n = 47 Significance level, α = 0.10 Claim:…
Q: Which of the following statements is NOT correct about the hypothesis test of comparing two…
A: We have to find that which of the following statements is NOT correct about the hypothesis test of…
Q: The following data represent the responses (Y for yes and N for no) from a sample of 20 college…
A: The formula for standard error of the population proportion is given by S.E…
Q: A producer invents an additive to increase the life of an automobile battery he produces. If the…
A: Given data The mean life time of the battery without additive is 48 months
Q: For a particular regression analysis, SST = 218.8548 and SSR = 205.2173. a. Obtain the coefficient…
A: Given dataSST=218.8548SSR=205.2173
Q: Let X, Y be positive random variables (not necessarily independent). Assuming X, Y have all finite…
A: Since you have posted a question with multiple sub parts, according to our guidelines we can solve…
Q: The closing prices for 5 days in early 2020 for a share of Disney Stock are reflected in the table…
A: Exponential smoothing: The newest to oldest observations are given exponentially decreasing weights…
Q: Problem 3: A random process X(t) is described by the following: X(t)= |A+t| where A is a RV that is…
A: Uniform Distribution The continuous uniform distribution or rectangular distribution could be a…
Q: y = a + B₁X₁ + B₂X₂ + B3X3 + B4X4 + e (a) If a = 21.06, B₁ = 0.651, B₂ = 0.0023, 3= -0.0205, and 4 =…
A: Given: y= mean yield(percent) x1= planting data(days after April 20) X2= planting density (10,000…
Q: Consider the following hypothesis test: Ho: μ = 17 Ha: # 17 A sample of 50 provided a sample mean of…
A:
Q: Zazil’s Instagram reels over the year have averaged around 70 likes per art reel with a standard…
A: According to the above situation, Zazil wants to test if adding trendy music over a reel increases…
Q: Customers at the local Subway store order an ice tea with their meal 35% of the time. Use the…
A: The given sample size is 8, and probability of success is 0.35.
Q: Given a population of class sizes at a university in an academic year, indicate what the sampling…
A: Given that A population of class sizes at a university in an academic year We have to choose the…
Q: Find the value of k for which the given function is a probability density function. f(x) = kekx on…
A: Given: Probability density function fx=kekx on 0, 7 The objective is to find the value of k.
Q: The following table shows the hot dogs bought from a street vendor over the course of eight days…
A: given
Q: How do you interpret a coefficient of determination, r², equal to 0.83? Choose the correct answer…
A: Given data, r2 = 0.83
Q: Boran Stockbrokers, Inc., selects four stocks for the purpose of developing its own index of stock…
A: Given that: Stock Industry Year 1 Quantity Price per Share (s) Year 1 Base January Year 3…
Q: 9.9 Driving (Example 10) Drivers in Wyoming drive more miles yearly than motorists in any other…
A: Given that Mean = M = 22306 Standard deviation = SD = 5500 Sample size = n = 200
Q: Use the sample data and confidence level given below to complete parts (a) through (d). A research…
A: We have given thatn = 1086x = 592Confidence level (c) = 99% = 0.99 Significance level (α) = 0.01
Q: Listed below are systolic blood pressure measurements (in mm Hg) obtained from the same woman. Find…
A: Given data Right arm 102 101 94 78 78 left arm 174 167…
Q: The results shown to the right provide the X-values, residuals, and a residual plot from a…
A: Given data A residual plot from a regression analysis is given
Q: A certain test is designed to measure the satisfaction of an individual with his/her relationship.…
A: The following information has been provided: Let X be a random variable represents the…
Q: Below is a summary table from an analysis of variance in which means from three groups are compared.…
A: Given that: Sources SS df MS F Between-groups 29.78 Within-groups 2.36 Total…
Q: Prob-7 Hospital workers who are routinely involved administrative radioactive tracer to patients are…
A: Solution: Given information: n= 28 Sample size x=5.145 Sample mean s= 0.7524 Sample standard…
Q: 7. Prepare a histogram and frequency polygon from the following data. X 0 10 10-20 f 13 17 20-30…
A:
Q: A clinical trial was conducted to test the effectiveness of the drug zopiclone for treating insomnia…
A: From given data we have: n=21 x=80.7 s=24.9
Q: 9.57 One of the issues facing organizations is increasing diversity throughout an organization. One…
A: From the provided information, 9 of 17 employees in a particular position were female. Level of…
Step by step
Solved in 2 steps
- A researcher found that a cigarette smoker smokes on average 30 cigarettes a day. She feels that this average is too high. She selected a random sample of 9 smokers and found that the mean number of cigarettes they smoked per day was 29. The sample standard deviation was 2.3. At =α0.05, is there enough evidence to support her claim? Assume that the population is approximately normally distributed. Use the critical value method and tables.A researcher found that a cigarette smoker smokes on average 30 cigarettes a day. She feels that thisaverage is too high. She selected a random sample of 9 smokers and found that the mean number of cigarettes they smoked perday was 29. The sample standard deviation was 2.3. At a =0.05, is there enough evidence to support her claim? Assume that thepopulation is approximately normally distributed. Use the critical value method and tables. h0: h1:A vonsuner group claims that thr mean minimum time it takes for a sedan to travel a quarter mile is greater than 14.5 seconds. A random samoke of 23 sedans has a mean minimum time to travel a quarter mile of 15.3 seconds and a standard deviation of 2.12 seconds. At a=0.10 is there enough evidence to support the consumer group's claim? Assume the population is normally distributed. i) Identify the claim and state Ho Ha H0 ii) Give the P-value: P=0.042, find tge standardized test statistic, t= iii) Decide wheter to reject or faik to reject the null hypothesis. H0 because the P-value
- 50 soil samples from a contruction site were tested for shear strength. The mean of the samples was determined to be 4270kN/m^2. The standard deviation was estimated to be 553kN/m^2. Assuming the data are normally distributed, what is the minimum shear stregnth that can be used for design if we accept a risk that 1% of test sample will fall bellow that minimum strength?An article suggests the uniform distribution on the interval (6.5, 21) as a model for depth (cm) of the bioturbation layer in sediment in a certain region. What is the probability that the observed depth is within 2 standard deviations of the mean value?Show that when α→q and β remains constant, themoment-generating function of a standardized gammarandom variable approaches the moment-generatingfunction of the standard normal distribution.