Shown below are the scatter plots for four different data sets. Answer the questions that follow. The same response may be the correct answer for more than one question. 11 f 10- 11 fy 10- 10- 9. 10- 9- 9. 9- 8 8- 7. 8- * Xx X X Xx X XX 7. 6. 6- 5. 5- 4. 4- 3. 2. 1. Figure 1 Figure 2 Figure 3 Figure 4 1. Which data set has an apparent positive, but not perfect, linear relationship between its two variables? Choose one 2. For which data set does the correlation coefficient r appear to be equal to - 1? Choose one 3. Which data set indicates the strongest linear relationship between its two variables? Choose one
Shown below are the scatter plots for four different data sets. Answer the questions that follow. The same response may be the correct answer for more than one question. 11 f 10- 11 fy 10- 10- 9. 10- 9- 9. 9- 8 8- 7. 8- * Xx X X Xx X XX 7. 6. 6- 5. 5- 4. 4- 3. 2. 1. Figure 1 Figure 2 Figure 3 Figure 4 1. Which data set has an apparent positive, but not perfect, linear relationship between its two variables? Choose one 2. For which data set does the correlation coefficient r appear to be equal to - 1? Choose one 3. Which data set indicates the strongest linear relationship between its two variables? Choose one

Chapter2: Basic Statistical Analysis With Excel
Section: Chapter Questions
Problem 4P

Related questions
Question
100%
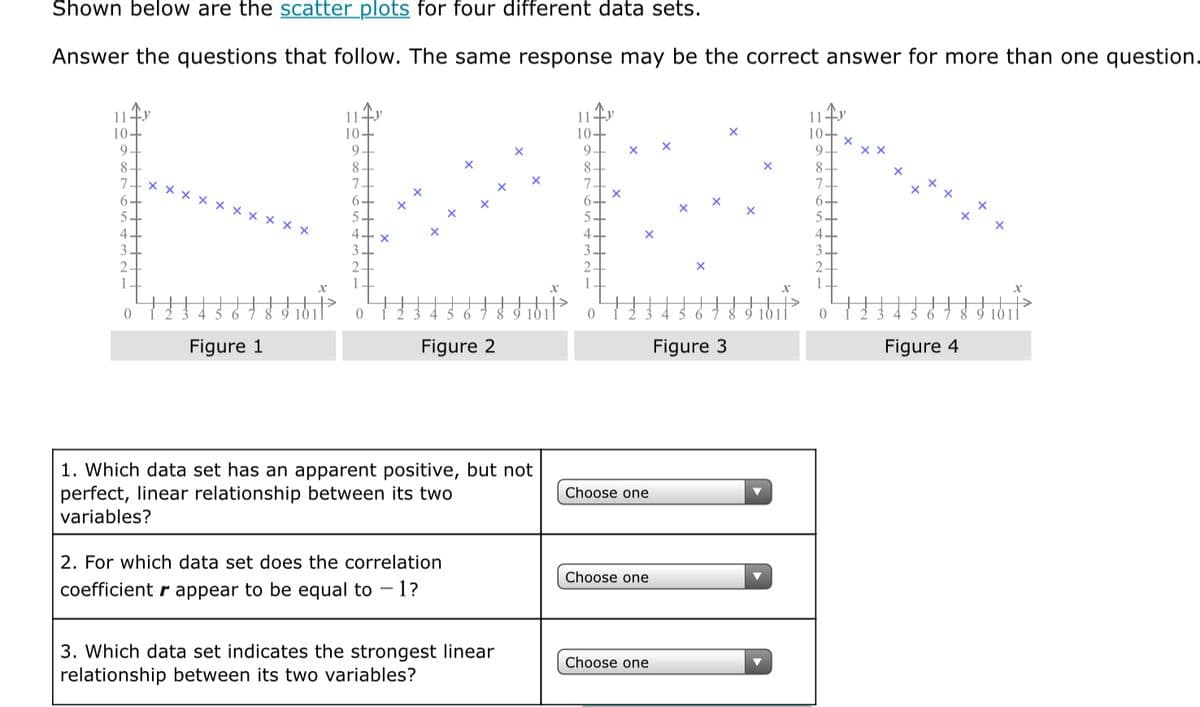
Transcribed Image Text:Shown below are the scatter plots for four different data sets.
Answer the questions that follow. The same response may be the correct answer for more than one question.
114y
10-
11fy
10-
9.
11fy
10-
11
10-
9.
8.
9
9
8
8
8-
7
* ** x x x x x x
7
7.
6-
6-
5.
5-
4
4
4
3
3
3.
3
2.
7 8
Figure 1
Figure 2
Figure 3
Figure 4
1. Which data set has an apparent positive, but not
perfect, linear relationship between its two
Choose one
variables?
2. For which data set does the correlation
Choose one
coefficient r appear to be equal to - 1?
3. Which data set indicates the strongest linear
relationship between its two variables?
Choose one
Expert Solution
This question has been solved!
Explore an expertly crafted, step-by-step solution for a thorough understanding of key concepts.

Step by step
Solved in 2 steps with 1 images

Recommended textbooks for you

Principles of Instrumental Analysis
Chemistry
ISBN:
9781305577213
Author:
Douglas A. Skoog, F. James Holler, Stanley R. Crouch
Publisher:
Cengage Learning
Principles of Instrumental Analysis
Chemistry
ISBN:
9781305577213
Author:
Douglas A. Skoog, F. James Holler, Stanley R. Crouch
Publisher:
Cengage Learning

Chemistry & Chemical Reactivity
Chemistry
ISBN:
9781133949640
Author:
John C. Kotz, Paul M. Treichel, John Townsend, David Treichel
Publisher:
Cengage Learning