Simon Company's year-end balance sheets follow. At December 31 Assets Cash Accounts receivable, net Merchandise inventory Prepaid expenses Plant assets, net Total assets Current Year 1 Year Ago $ 42,304 $ 35,467 102,794 127,925 11,888 335,329 74,031 95,871 11,327 305, 263 $ 613,403 $ 528,796 Liabilities and Equity Accounts payable Long-term notes payable Common stock, $10 par value Retained earnings Total liabilities and equity For both the current year and one year ago, compute the following ratios: $ 486,429 247,201 $ 149,683 117,626 162,500 183,594 $ 88,473 125,272 162,500 152,551 $ 613,403 $ 528,796 13,556 10,367 The company's income statements for the Current Year and 1 Year Ago, follow. Current Year 1 Year Ago For Year Ended December 31 Sales Cost of goods sold Other operating expenses $ 797,424 Interest expense Income tax expense Total costs and expenses Net income Earnings per share Additional information about the company follows. Common stock market price, December 31, Current Year Common stock market price, December 31, 1 Year Ago Annual cash dividends per share in Current Year 757,553 $ 39,871 $2.45 2 Years Ago $ 409,024 159,205 14,473 9,439 $ 32.00 30.00 0.28 $ 43,194 57,592 63, 194 4,751 267,569 $ 436,300 $ 57,016 94,494 163,500 121,290 $ 436,300 $ 629,267 592, 141 $ 37, 126 $2.28
Simon Company's year-end balance sheets follow. At December 31 Assets Cash Accounts receivable, net Merchandise inventory Prepaid expenses Plant assets, net Total assets Current Year 1 Year Ago $ 42,304 $ 35,467 102,794 127,925 11,888 335,329 74,031 95,871 11,327 305, 263 $ 613,403 $ 528,796 Liabilities and Equity Accounts payable Long-term notes payable Common stock, $10 par value Retained earnings Total liabilities and equity For both the current year and one year ago, compute the following ratios: $ 486,429 247,201 $ 149,683 117,626 162,500 183,594 $ 88,473 125,272 162,500 152,551 $ 613,403 $ 528,796 13,556 10,367 The company's income statements for the Current Year and 1 Year Ago, follow. Current Year 1 Year Ago For Year Ended December 31 Sales Cost of goods sold Other operating expenses $ 797,424 Interest expense Income tax expense Total costs and expenses Net income Earnings per share Additional information about the company follows. Common stock market price, December 31, Current Year Common stock market price, December 31, 1 Year Ago Annual cash dividends per share in Current Year 757,553 $ 39,871 $2.45 2 Years Ago $ 409,024 159,205 14,473 9,439 $ 32.00 30.00 0.28 $ 43,194 57,592 63, 194 4,751 267,569 $ 436,300 $ 57,016 94,494 163,500 121,290 $ 436,300 $ 629,267 592, 141 $ 37, 126 $2.28

Managerial Accounting: The Cornerstone of Business Decision-Making
7th Edition
ISBN:9781337115773
Author:Maryanne M. Mowen, Don R. Hansen, Dan L. Heitger
Publisher:Maryanne M. Mowen, Don R. Hansen, Dan L. Heitger
Chapter15: Financial Statement Analysis
Section: Chapter Questions
Problem 40E: Cuneo Companys income statements for the last 3 years are as follows: Refer to the information for...

Related questions
Question
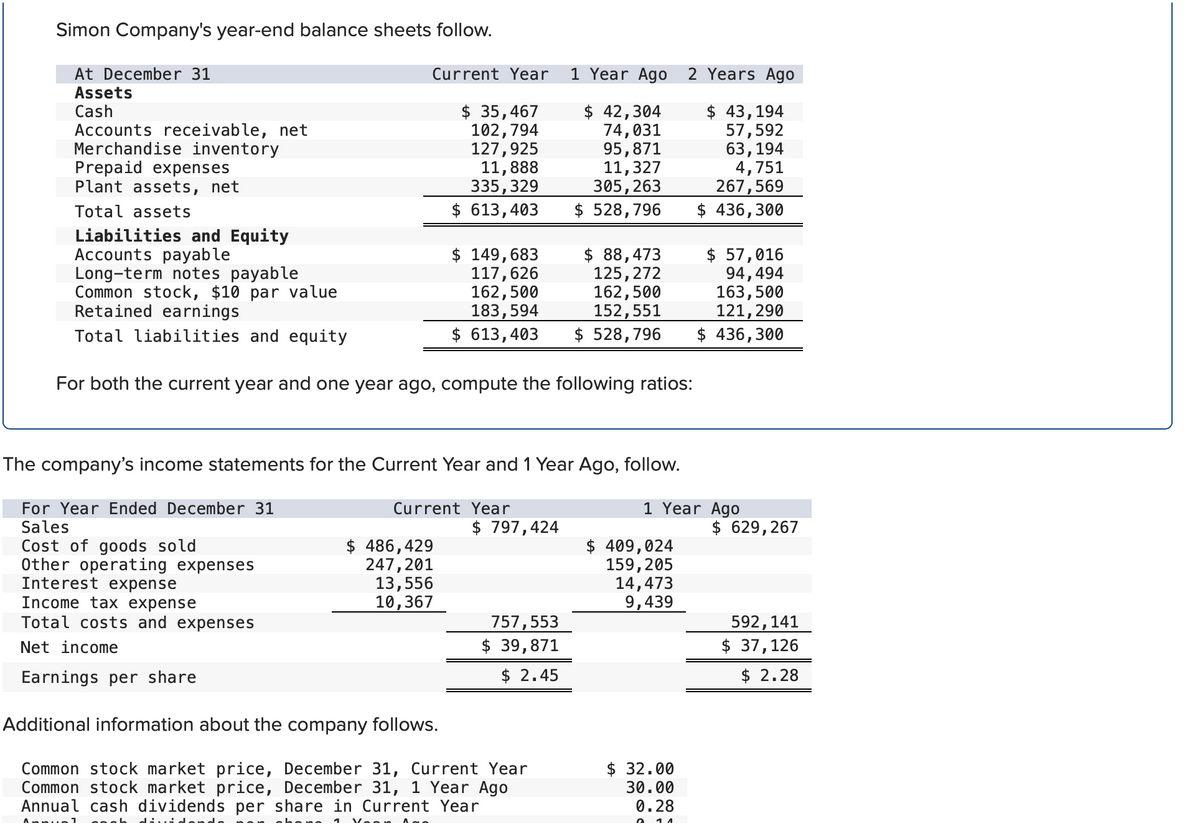
Transcribed Image Text:Simon Company's year-end balance sheets follow.
At December 31
Assets
Cash
Accounts receivable, net
Merchandise inventory
Prepaid expenses
Plant assets, net
Total assets
Liabilities and Equity
Accounts payable
Long-term notes payable
Common stock, $10 par value
Retained earnings
Total liabilities and equity
Interest expense
Income tax expense
Total costs and expenses
Net income
Current Year
$ 35,467
102,794
127,925
11,888
335,329
$ 613,403
For both the current year and one year ago, compute the following ratios:
ه له مه له :. .: له
The company's income statements for the Current Year and 1 Year Ago, follow.
For Year Ended December 31
Sales
Cost of goods sold
Other operating expenses
$ 149,683
117,626
162,500
183,594
$ 613,403
$ 486,429
247,201
Current Year
13,556
10,367
Vanu
$ 797,424
Earnings per share
Additional information about the company follows.
Common stock market price, December 31, Current Year
Common stock market price, December 31, 1 Year Ago
Annual cash dividends per share in Current Year
Ammin1
1 Year Ago 2 Years Ago
$ 42,304
74,031
95,871
11,327
305,263
$ 528,796
757, 553
$ 39,871
$ 2.45
$ 88,473
125,272
162,500
152, 551
$ 528,796
$ 409,024
159, 205
14,473
9,439
$ 43,194
57,592
$ 32.00
30.00
0.28
11
63, 194
4,751
267,569
$ 436,300
1 Year Ago
$ 57,016
94,494
163,500
121,290
$ 436,300
$ 629,267
592,141
$ 37, 126
$ 2.28
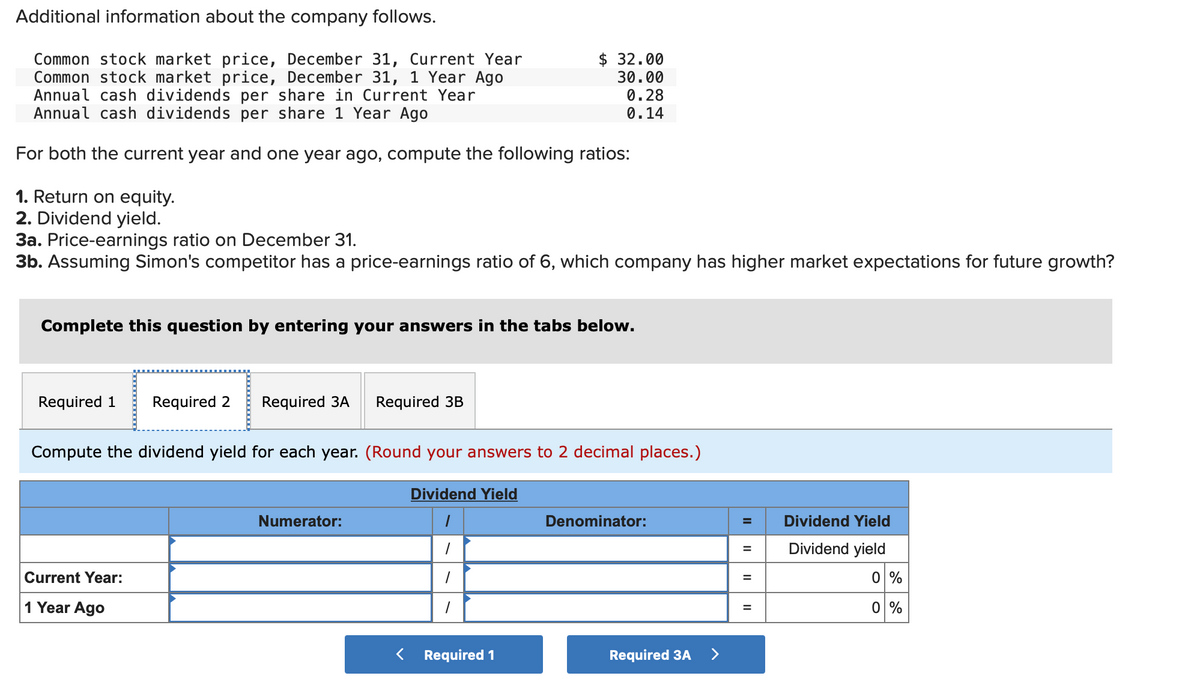
Transcribed Image Text:Additional information about the company follows.
Common stock market price, December 31, Current Year
Common stock market price, December 31, 1 Year Ago
Annual cash dividends per share in Current Year
Annual cash dividends per share 1 Year Ago
For both the current year and one year ago, compute the following ratios:
1. Return on equity.
2. Dividend yield.
3a. Price-earnings ratio on December 31.
3b. Assuming Simon's competitor has a price-earnings ratio of 6, which company has higher market expectations for future growth?
Complete this question by entering your answers in the tabs below.
Required 1 Required 2 Required 3A
Current Year:
1 Year Ago
Required 3B
Compute the dividend yield for each year. (Round your answers to 2 decimal places.)
Numerator:
$32.00
30.00
0.28
0.14
Dividend Yield
1
1
1
Required 1
Denominator:
Required 3A
>
=
=
=
=
Dividend Yield
Dividend yield
0 %
0%
Expert Solution
This question has been solved!
Explore an expertly crafted, step-by-step solution for a thorough understanding of key concepts.

Step by step
Solved in 2 steps with 5 images

Knowledge Booster


Learn more about
Need a deep-dive on the concept behind this application? Look no further. Learn more about this topic, accounting and related others by exploring similar questions and additional content below.Recommended textbooks for you
Managerial Accounting: The Cornerstone of Busines…
Accounting
ISBN:
9781337115773
Author:
Maryanne M. Mowen, Don R. Hansen, Dan L. Heitger
Publisher:
Cengage Learning

Managerial Accounting
Accounting
ISBN:
9781337912020
Author:
Carl Warren, Ph.d. Cma William B. Tayler
Publisher:
South-Western College Pub

Financial And Managerial Accounting
Accounting
ISBN:
9781337902663
Author:
WARREN, Carl S.
Publisher:
Cengage Learning,
Managerial Accounting: The Cornerstone of Busines…
Accounting
ISBN:
9781337115773
Author:
Maryanne M. Mowen, Don R. Hansen, Dan L. Heitger
Publisher:
Cengage Learning
Managerial Accounting
Accounting
ISBN:
9781337912020
Author:
Carl Warren, Ph.d. Cma William B. Tayler
Publisher:
South-Western College Pub
Financial And Managerial Accounting
Accounting
ISBN:
9781337902663
Author:
WARREN, Carl S.
Publisher:
Cengage Learning,

Intermediate Accounting: Reporting And Analysis
Accounting
ISBN:
9781337788281
Author:
James M. Wahlen, Jefferson P. Jones, Donald Pagach
Publisher:
Cengage Learning

Financial Accounting
Accounting
ISBN:
9781337272124
Author:
Carl Warren, James M. Reeve, Jonathan Duchac
Publisher:
Cengage Learning

Cornerstones of Financial Accounting
Accounting
ISBN:
9781337690881
Author:
Jay Rich, Jeff Jones
Publisher:
Cengage Learning