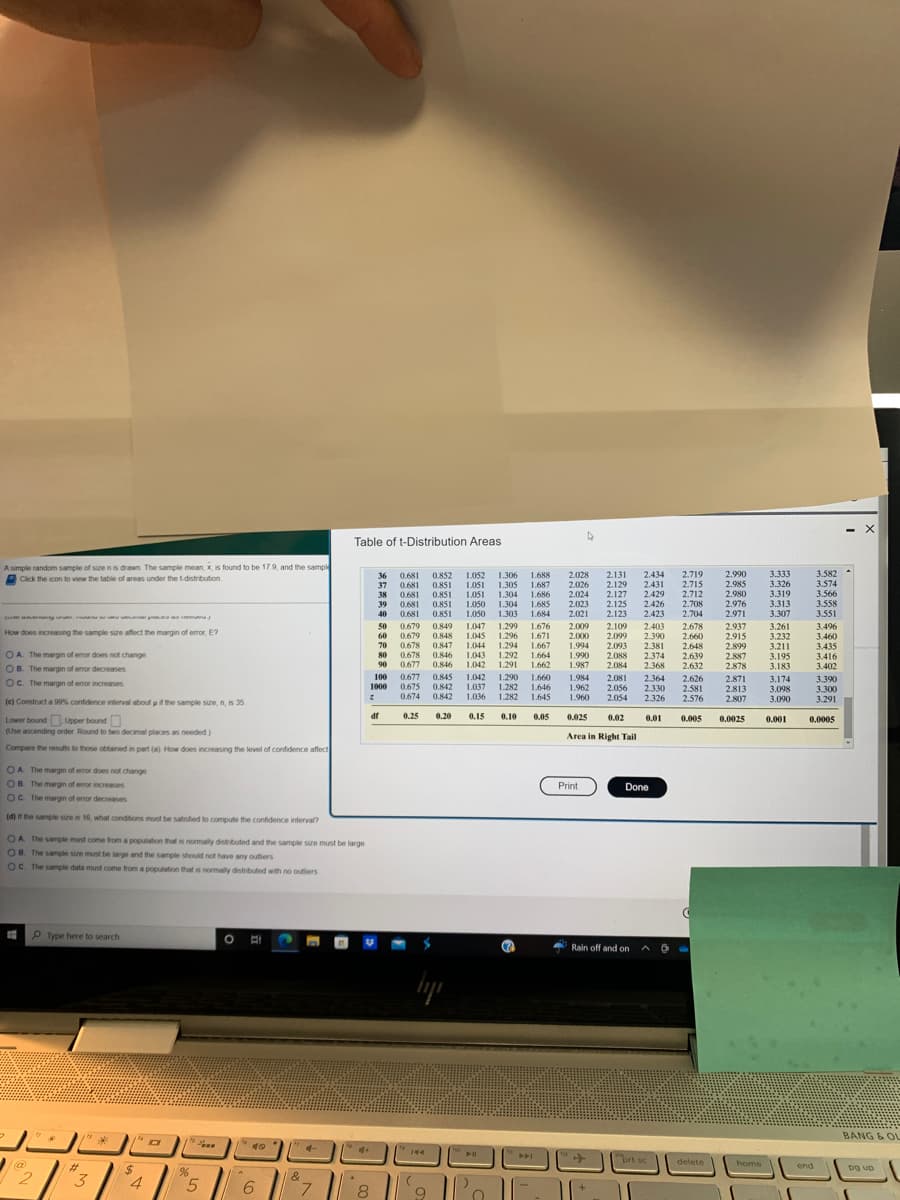
simple random sample of size n is drawn. The sample mean, x, is found to be 17.9, and the sample standard deviation, s, is found to be 4.7. Click the icon to view the table of areas under the t-distribution. ) Construct a 95% confidence interval about us if the sample size, n, is 35. mwer bound: Upper bound: se ascending order. Round to two decimal places as needed.) Construct a 95% confidence interval about u if the sample size, n, is 51. wer bound Upper bound: se ascending order. Round to two decimal places as needed.) w does increasing the sample size affect the margin of error, E? A. The margin of error does not change. B. The margin of error decreases. C. The margin of error increases. Construct a 99% confidence interval about us if the sample size, n, is 35. er bound Upper bound: ascending order. Round to two decimal places as needed.) mpare the results to those obtained in part (a). How does increasing the level of confidence affect the size of the margin of error, E? The margin of error does not change. . The margin of error increases. The main of nen drengene Type here to search O Rain o
simple random sample of size n is drawn. The sample mean, x, is found to be 17.9, and the sample standard deviation, s, is found to be 4.7. Click the icon to view the table of areas under the t-distribution. ) Construct a 95% confidence interval about us if the sample size, n, is 35. mwer bound: Upper bound: se ascending order. Round to two decimal places as needed.) Construct a 95% confidence interval about u if the sample size, n, is 51. wer bound Upper bound: se ascending order. Round to two decimal places as needed.) w does increasing the sample size affect the margin of error, E? A. The margin of error does not change. B. The margin of error decreases. C. The margin of error increases. Construct a 99% confidence interval about us if the sample size, n, is 35. er bound Upper bound: ascending order. Round to two decimal places as needed.) mpare the results to those obtained in part (a). How does increasing the level of confidence affect the size of the margin of error, E? The margin of error does not change. . The margin of error increases. The main of nen drengene Type here to search O Rain o

MATLAB: An Introduction with Applications
6th Edition
ISBN:9781119256830
Author:Amos Gilat
Publisher:Amos Gilat
Chapter1: Starting With Matlab
Section: Chapter Questions
Problem 1P

Related questions
Question
Transcribed Image Text:A simple random sample of size n is drawn. The sample mean, x, is found to be 17.9, and the sampl
Click the icon to view the table of areas under the 1-distribution.
fue any pro svou/
How does increasing the sample size affect the margin of error, E?
OA. The margin of error does not change.
OB. The margin of error decreases
OC. The margin of error increases
(e) Construct a 99% confidence interval about if the sample size, n, is 35
p
Lower bound Upper bound
(Use ascending order Round to two decimal places as needed)
Compare the results to those obtained in part (a) How does increasing the level of confidence affect
OA. The margin of error does not change
OB. The margin of error increases
OC. The margin of error decreases
(d) If the sample size is 16, what conditions must be satisfied to compute the confidence interval?
OA. The sample must come from a population that is normally distributed and the sample size must be large
OB. The sample size must be large and the sample should not have any outlers
OC. The sample data must come from a population that is normally distributed with no outliers
#
Type here to search
O HI
ST
1" *
@
2
تھا جو
3
$
fa
4
a
%
5
A
40
6
&
7
Table of t-Distribution Areas.
A
36 0.681 0.852 1.052 1.306 1.688
0.681 0.851 1.051 1.305 1.687
0.681 0.851 1.051 1.304 1.686
37
38
39
2.028 2.131
2.026 2.129
2.024 2.127
2.023 2.125
2.021 2.123 2.423 2.704
2.434 2.719 2.990
2.431 2.715 2.985
2.429 2.712 2.980
2.426 2.708
2.976
40
2.971
50
0.679 0.849
2.109 2.403 2.678
2.937
60
0.679 0.848
2.915
70
0.678 0.847
2.899
80
2.887
0.681 0.851 1.050 1.304 1.685
0.681 0.851 1.050 1.303 1.684
1.047 1.299 1.676 2.009
1.045 1.296 1.671 2.000 2.099 2.390 2.660
1.044 1.294 1.667 1.994 2.093 2.381 2.648
0.678 0.846 1.043 1.292 1.664 1.990 2.088 2.374 2.639
0.677 0.846 1.042 1.291 1.662
2.368 2.632
0.677 0.845 1.042 1.290 1.660 1.984 2.081 2.364 2.626
0.675 0.842 1.037 1.282 1.646
2.056 2.330 2.581
0.674 0.842 1.036 1.282 1.645
2.054 2.326 2.576
0.05
1.987
2.084
2.878
90
100
1000
z
2.871
2.813
2.807
1.962
1.960
0.025
df
0.25 0.20 0.15 0.10
0.005 0.0025
0.02 0.01
Area in Right Tail
Print
Done
1.
4+
8
70
lyr
144
(
9
All
O
A
Rain off and on
+
(
^.
prt sc
delete
home
3.333
3.326
3.319
3.313
3.307
3.261
3.232
3.211
3.195
3.183
3.174
3.098
3.090
0.001
- X
3.582.
3.574
3.566
3.558
3.551
3.496
3.460
3.435
3.416
3.402
3.390
3.300
3.291
0.0005
end
BANG & OL
pg up
Transcribed Image Text:A simple random sample of size n is drawn. The sample mean, x, is found to be 17.9, and the sample standard deviation, s, is found to be 4.7.
Click the icon to view the table of areas under the t-distribution.
(a) Construct a 95% confidence interval about u if the sample size, n, is 35.
Lower bound: Upper bound:
(Use ascending order. Round to two decimal places as needed.)
(b) Construct a 95% confidence interval about u if the sample size, n, is 51.
Lower bound:: Upper bound:
(Use ascending order. Round to two decimal places as needed.)
How does increasing the sample size affect the margin of error, E?
OA. The margin of error does not change.
OB. The margin of error decreases.
OC. The margin of error increases.
(c) Construct a 99% confidence interval about u if the sample size, n, is 35.
Lower bound:: Upper bound:
(Use ascending order. Round to two decimal places as needed.)
Compare the results to those obtained in part (a). How does increasing the level of confidence affect the size of the margin of error, E?
OA. The margin of error does not change.
OB. The margin of error increases.
The marnin of orror derengene
#
Type here to search
O A
4
Rain of
Expert Solution
This question has been solved!
Explore an expertly crafted, step-by-step solution for a thorough understanding of key concepts.

This is a popular solution!

Trending now
This is a popular solution!

Step by step
Solved in 4 steps with 4 images

Recommended textbooks for you
MATLAB: An Introduction with Applications
Statistics
ISBN:
9781119256830
Author:
Amos Gilat
Publisher:
John Wiley & Sons Inc

Probability and Statistics for Engineering and th…
Statistics
ISBN:
9781305251809
Author:
Jay L. Devore
Publisher:
Cengage Learning

Statistics for The Behavioral Sciences (MindTap C…
Statistics
ISBN:
9781305504912
Author:
Frederick J Gravetter, Larry B. Wallnau
Publisher:
Cengage Learning
MATLAB: An Introduction with Applications
Statistics
ISBN:
9781119256830
Author:
Amos Gilat
Publisher:
John Wiley & Sons Inc
Probability and Statistics for Engineering and th…
Statistics
ISBN:
9781305251809
Author:
Jay L. Devore
Publisher:
Cengage Learning
Statistics for The Behavioral Sciences (MindTap C…
Statistics
ISBN:
9781305504912
Author:
Frederick J Gravetter, Larry B. Wallnau
Publisher:
Cengage Learning

Elementary Statistics: Picturing the World (7th E…
Statistics
ISBN:
9780134683416
Author:
Ron Larson, Betsy Farber
Publisher:
PEARSON

The Basic Practice of Statistics
Statistics
ISBN:
9781319042578
Author:
David S. Moore, William I. Notz, Michael A. Fligner
Publisher:
W. H. Freeman

Introduction to the Practice of Statistics
Statistics
ISBN:
9781319013387
Author:
David S. Moore, George P. McCabe, Bruce A. Craig
Publisher:
W. H. Freeman