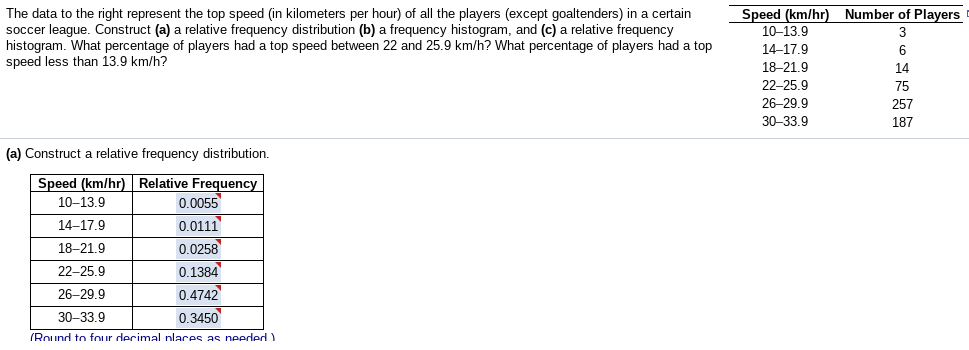
Speed (km/hr) Number of Players 10-13.9 The data to the right represent the top speed (in kilometers per hour) of all the players (except goaltenders) in a certain soccer league. Construct (a) a relative frequency distribution (b) a frequency histogram, and (c) a relative frequency histogram. What percentage of players had a top speed between 22 and 25.9 km/h? What percentage of players had a top speed less than 13.9 km/h? 3 14–17.9 6 18-21.9 14 22-25.9 75 26-29.9 257 30-33.9 187 (a) Construct a relative frequency distribution. Speed (km/hr) | Relative Frequency 0.0055 10–13.9 14–17.9 0.0111 18-21.9 0.0258 22–25.9 0.1384 0.4742 0.3450 26–29.9 30-33.9 (Round to four decimal nlaces as needed)


Inverse Normal Distribution
The method used for finding the corresponding z-critical value in a normal distribution using the known probability is said to be an inverse normal distribution. The inverse normal distribution is a continuous probability distribution with a family of two parameters.
Mean, Median, Mode
It is a descriptive summary of a data set. It can be defined by using some of the measures. The central tendencies do not provide information regarding individual data from the dataset. However, they give a summary of the data set. The central tendency or measure of central tendency is a central or typical value for a probability distribution.
Z-Scores
A z-score is a unit of measurement used in statistics to describe the position of a raw score in terms of its distance from the mean, measured with reference to standard deviation from the mean. Z-scores are useful in statistics because they allow comparison between two scores that belong to different normal distributions.
How was the following relative frequency answers on the bottom left corner found from the data table on the upper right corner?


Trending now
This is a popular solution!

Step by step
Solved in 5 steps with 2 images


