Statdisk Source: Interaction: Row Variable: Column Variable: 1 345.6 Test Stat, F: Critical F: P-Value: DF: SS: 2 2779.2 MS: 1389.6 9.58 3.1682 3.1682 4.0195 0.0003 0.4947 2 206.9333 103.4667 0.7130 345.6 0.1286 2.3816


Q: Statistics students in Oxnard College sampled 9 textbooks in the Condor bookstore and recorded the…
A: Step-by-step procedure to find the regression line using Excel: In Excel sheet, enter x and y in…
Q: Statistics students in Oxnard College sampled 11 textbooks in the Condor bookstore and recorded the…
A: The linear model is given by: y = bx + a Here, 'a' is the y-intercept and 'b' is the slope…
Q: Scraps of iron were selected on the basis of their densities, x, and their iron contents, y, were…
A: A scatter plot is used to visualise the relation between two variables. Each data point is plated on…
Q: Inertial weight (in tons) and fuel economy (in mi/gal) were measured for a sample of seven diesel…
A: (a)
Q: Statistics students in Oxnard College sampled 9 textbooks in the Condor bookstore, and recorded…
A: Given Dataset No of Pages(x) Score(y) X2 Y2 xy 266 38.26 70756 1463.828…
Q: Statistics students in Oxnard College sampled 9 textbooks in the Condor bookstore and recorded the…
A: We have given that, X :- 824, 573, 683, 634, 862, 279, 397, 889, 405 Y:- 76.68, 52.11, 58.81,…
Q: Statistics students in Oxnard College sampled 9 textbooks in the Condor bookstore and recorded the…
A: In this case Number of Pages (x) is the independent variable and Cost (y) is the dependent variable.
Q: Statistics students in Oxnard College sampled 9 textbooks in the Condor bookstore and recorded the…
A:
Q: An economist want to determine the relation between one's FICO score, x, and the interest rate of a…
A:
Q: student calculates a linear model yy = xx + . (Please show your answers to two decimal places) Use…
A: Given that : X Y X \cdot YX⋅Y X^2X2 Y^2Y2 709 90.99 64511.91 502681 8279.1801 497 76.67…
Q: Statistics students in Oxnard College sampled 9 textbooks in the Condor bookstore and recorded the…
A: Given information- We have given the bivariate data which consist 9 textbooks in the Condor…
Q: Statistics students in Oxnard College sampled 9 textbooks in the Condor bookstore, and recorded…
A:
Q: Statistics students in Oxnard College sampled 9 textbooks in the Condor bookstore, and recorded the…
A: Solution
Q: A student calculates a linear model y= blank x + blank . (Please show your answers to two decimal…
A: The regression analysis is conducted using EXCEL. The software procedure is given below: Enter the…
Q: A student calculates a linear model yy = xx + . (Please show your answers to two decimal places)…
A: Number of Pages (x) Cost(y) (x-xbar) (x-xbar)^2 (y-ybar) (y-ybar)^2 (x-xbar)*(y-ybar) 544 60.84…
Q: Statistics students in Oxnard College sampled 9 textbooks in the Condor bookstore, and recorded…
A:
Q: A student calculates a linear model yy = xx + . (Please show your answers to two decimal places)…
A: Given Information: Sample size (n) = 11 The data represents cost of 11 textbooks in the Condor…
Q: Statistics students in Oxnard College sampled 10 textbooks in the Condor bookstore, and recorded…
A:
Q: hree types of fertilizer were used on 126 identical plots of maize. Each plot was harvested and the…
A: The level of significance is 0.05 Null hypothesis: H0: Fertilizers and yield of maize are…
Q: Statistics students in Oxnard College sampled 10 textbooks in the Condor bookstore and recorded the…
A: The linear regression of Y on X is, Y=a+bXwhere, a=y-interceptb=slope of the regerssion…
Q: Statistics students in Oxnard College sampled 10 textbooks in the Condor bookstore and recorded the…
A: Given data, Number of pages Cost 205 39.45 531 70.79 218 42.62 905 84.45 971 98.39…
Q: Statistics students in Oxnard College sampled 11 textbooks in the Condor bookstore, and recorded…
A: Solution: Let X be the number of pages and Y be the cost. The regression equation is obtained by…
Q: A student calculates a linear model yy = xx + . (Please show your answers to two decimal places)…
A: The regression analysis is conducted using EXCEL. The software procedure is given below: Enter the…
Q: The data in the table represent the number of licensed drivers in various age groups and the number…
A: The least-square regression line for males, x y x2 y2 x⋅y 12 227 144 51529 2724 6424 5180…
Q: Exotic Plants. In the article “Effects of Human Population, Area, and Time on Non-native Plant and…
A: Hey there! Thank you for posting the question. Since your question has more than 3 parts, we are…
Q: Statistics students in Oxnard College sampled 11 textbooks in the Condor bookstore and recorded the…
A: We have given that, X:- 827, 471, 561, 794, 731, 296, 515, 590, 810, 960, 632 Y:- 85.7, 58.1, 68.1,…
Q: Given the data below, develop a linear regression model between compressive strength and density.…
A: Use the following formulae, to calculate the regression coefficients and the correlation…
Q: An engineer wants to determine how the weight of a gas-powered car, x, affects gas mileage, y. The…
A:
Q: Statistics students in Oxnard College sampled 11 textbooks in the Condor bookstore, and recorded…
A:
Q: Statistics students in Oxnard College sampled 10 textbooks in the Condor bookstore and recorded the…
A: Number of pages Cost 504 6852 792 111.96 535 85.55 270 38.1 213 36.69 996 141.48 780…
Q: Statistics students in Oxnard College sampled 11 textbooks in the Condor bookstore, and recorded the…
A: Solution Steps for calculates a linear model So A student calculates a linear modely = 0.09x +…
Q: Statistics students in Oxnard College sampled 9 textbooks in the Condor bookstore and recorded the…
A: The given data show the number of pages (x) and cost (y).
Q: The data in the table represent the number of licensed drivers in various age groups and the number…
A: The simple linear regression is used to estimate or predict the response variables. It consist of…
Q: Exercise (please attempt) A researcher wishes to build an appropriate multiple linear model for…
A: Hi! Thank you for the question, As per the honor code, we are allowed to answer three sub-parts at a…
Q: An engineer wants to determine how the weight of a car, x, affects gas mileage, y. The following…
A: Use EXCEL to determine the regression equation. EXCEL procedure: Go to EXCEL Go to…
Q: Statistics students in Oxnard College sampled 11 textbooks in the Condor bookstore and recorded the…
A: The independent variable is Number of Pages. The dependent variable is Cost. This is simple linear…
Q: Statistics students in Oxnard College sampled 9 textbooks in the Condor bookstore and recorded the…
A: Solution: Let X be the number of pages and Y be the cost. From the given information,
Q: Statistics students in Oxnard College sampled 11 textbooks in the Condor bookstore and recorded the…
A: From given data, x Y X*Y X*X 590 71.1 41949 348100 608 75.72 46037.76 369664 633 67.97…
Q: A study considered the porosity of an ultrafine powder of partially stabilized zirconia as a…
A: The scatter plot can be obtained using EXCEL software. Enter the values of X in column A and Y in…
Q: Statistics students in Oxnard College sampled 9 textbooks in the Condor bookstore and recorded the…
A:
Q: Statistics students in Oxnard College sampled 11 textbooks in the Condor bookstore and recorded the…
A: Given -The value of x and y are given, To use a simple linear regression model To find the linear…
Q: Statistics students in Oxnard College sampled 10 textbooks in the Condor bookstore, and recorded the…
A: Solution To calculate the regression line we first calculate the slope and intercept,then will…
Q: Statistics students in Oxnard College sampled 9 textbooks in the Condor bookstore and recorded the…
A:
Q: A company hold the statistics of the Advertising expenditure versus Sales income. Below is tne table…
A:
Q: Statistics students in Oxnard College sampled 11 textbooks in the Condor bookstore, and recorded…
A: The linear regression equation is y = ax + b.
Q: Statistics students in Oxnard College sampled 9 textbooks in the Condor bookstore and recorded the…
A: According to the question, the independent variable is Number of Pages (x) and the dependent…
Q: Statistics students in Oxnard College sampled 10 textbooks in the Condor bookstore and recorded the…
A: Given information- We have given that a statistics student in Oxnard college sampled 10 textbooks in…
Q: Statistics students in Oxnard College sampled 11 textbooks in the Condor bookstore and recorded the…
A:
Q: Statistics students in Oxnard College sampled 9 textbooks in the Condor bookstore and recorded the…
A: Consider from the given information, Number of Pages (xx) be X and cost(yy) be Y The data as shown…

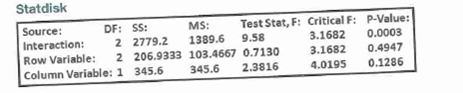
Pulse Rates If we use the data given in Exercise 1 with two-way analysis of variance, we get the accompanying display. What do you conclude?
Statdisk


Trending now
This is a popular solution!

Step by step
Solved in 2 steps


- One study investigated whether the thickness of the banana peel is related to the banana variety and the fertilizer used. The research examined 4 different banana varieties and 3 different fertilizers.The following values were calculated from the data:SSr = 3.4 SSc =1.3 SSe =1.2The research first set out to find out if there is a difference in the average thickness of the banana peel between the fertilizers used. The used fertilizers are presented in the material with columns.Calculate the p-value of the test. Give the answer to two decimal places. Remember the correct decimal separator.Three types of fertilizer were used on 126 identical plots of maize. Each plot was harvested and the yield (in kg) was recorded. Type of Fertilizer Yield (kg) I II III Row Total 0–2.9 11 10 15 36 3.0–5.9 16 21 11 48 6.0–8.9 16 16 10 42 Column Total 43 47 36 126 Use a 5% level of significance to test the hypothesis that type of fertilizer and yield of maize are independent. Interpret the results.What is the level of significance? Find the value of the chi-square statistic for the sample. (Round the expected frequencies to at least three decimal places. Round the test statistic to three decimal places.)What are the degrees of freedom?During a particularly dry growing season in a southern state, farmers noticed that there is a delicate balance between the number of seeds that are planted per square foot and the yield of the crop in pounds per square foot. The yields were the smallest when the number of seeds per square foot was either very small or very large. The data in the table show various numbers of seeds planted per square foot and yields (in pounds per square foot) for a sample of fields. A 2-column table with 15 rows. Column 1 is labeled number of seeds (per square foot) with entries 28, 75, 30, 43, 71, 35, 40, 59, 66, 79, 85, 81, 16, 33, 16. Column 2 is labeled yield (pounds per square foot) with entries 131, 171, 132, 166, 169, 150, 161, 183, 173, 161, 147, 157, 86, 145, 86. Which scatterplot represents the seed and yield data? A graph titled number of Seeds and Crop Yield has seeds (per square foot) on the x-axis, and yard (pounds per square foot) on the y-axis. The points curve up to a point, and…
- The table below shows the parameters for four multiple linear regression bridge deterioration models. The full model has age as continuous independent variable, traffic (Average Daily Traffic (ADT)) and bridge design as categorical variables. The bridge design is expressed as codes “H’ or “HS” for a single-unit truck and a tractor pulling a semitrailer respectively. The numeric suffix represents the gross weight in tons for H truck or weight on the first two axle sets of the HS truck. For example, H_10 denotes a truck with a gross work of 10 tons. The table also contains the following model validation indicators: adjusted r-squared, Akaike’s Information Criteria (AIC), Mean Absolute Error (MAE) and Bayesian Information Criteria (BIC). Write the multiple regression equation for each of the four models and comment on the accuracy of prediction of bridge deterioration of each model.The table below shows the parameters for four multiple linear regression bridge deterioration models. The full model has age as continuous independent variable, traffic (Average Daily Traffic (ADT)) and bridge design as categorical variables. The bridge design is expressed as codes “H’ or “HS” for a single-unit truck and a tractor pulling a semitrailer respectively. The numeric suffix represents the gross weight in tons for H truck or weight on the first two axle sets of the HS truck. For example, H_10 denotes a truck with a gross work of 10 tons. The table also contains the following model validation indicators: adjusted r-squared, Akaike’s Information Criteria (AIC), Mean Absolute Error (MAE) and Bayesian Information Criteria (BIC). Which model is the best predictor model, give logical justification for your answer. Discuss how these models are utilized in Highway Asset management.A well-known maker of jams and jellies packages its jams in jars labeled "~250 milliliters." The process used to fill the jars is known to dispense an amount of jam that is a Normally distributed variable µ = 252 milliliters and σ = 0.9 milliliters. What proportion of jars will be filled with what the label claims is 250 milliliters?
- Statistics students in Oxnard College sampled 9 textbooks in the Condor bookstore, and recorded number of pages in each textbook and its cost. The bivariate data is shown below, Number of Pages (xx) Cost(yy) 571 46.97 740 55.8 402 50.14 579 62.53 750 62.5 970 75.9 343 38.01 572 52.04 969 71.83 A student calculates a linear modelyy = xx + . (Please show your answers to two decimal places)Use the model above to estimate the cost when number of pages is 927 Cost = $ (Please show your answer to 2 decimal places.)Statistics students in Oxnard College sampled 11 textbooks in the Condor bookstore and recorded the number of pages in each textbook and its cost. The bivariate data are shown below: Number of Pages (xx) Cost(yy) 970 120.7 537 79.07 686 97.46 581 86.91 752 89.72 867 121.37 903 110.33 555 79.05 572 80.92 780 92.8 599 74.89 A student calculates a linear modelyy = xx + . (Please show your answers to two decimal places)Use the model to estimate the cost when number of pages is 569.Cost = $ (Please show your answer to 2 decimal places.)An agronomist undertook an experiment to investigate the factors that potato harvest. In his research, agronomist decided to divide the farm into 30 half hectare plots and apply varies level of fertilizer. Potato was then planted and the harvest at the end of the season was recorded. Fertilizer(Kg) Harvest (tons) 210 43.5 220 40.0 230 48.0 240 65.0 250 80.0 260 85.0 270 95.0 280 80.0 290 97.3 Note: No excel ANOVA output allowed. Students need to show all the steps in calculations. You are required to; Find the simple regression line and interpret the coefficients. Find the coefficient of determination and interpret its value. Does the model appear to be a useful tool in predicting the potato harvest? If so, predict the harvest when 250KG of fertilizer is applied. If not explain why not.
- The data below are for two different types of straw seed that were used on adjacent plots of land. The listed values are the yields of straw in cwt (100 lb, or hundredweight) per acre, and the yields are paired by the plot of land that they share. Complete parts (a) through (c). Type 1 Type 219.25 2523 23.7522.75 24.2522.75 28.2522.25 22.7519.5 19.7524.5 22.2515.5 1618 17.2514 1617 17.25 Using a 0.05 significance level, test the claim that there is no difference between the yields from the two types of seed. Let mu Subscript dμdbe the mean of the population of differences of type 1 minus type 2 and write the hypotheses. The null hypothesis is Upper H 0H0: Upper H 1H1: The test statistic is State the conclusion that addresses the original claim.Measuring the height of a California redwood tree is very difficult because these trees grow to heights of over 300 feet. People familiar with these trees understand that the height of a California redwood tree is related to other characteristics of the tree, including the diameter of the tree at the breast height of a person. The data in the table represent the height (in feet) and diameter (in inches) at the breast height of a person for a sample of 21 California redwood trees. Assuming a linear relationship, use the least- squares method to compute the regression coefficients b0 and b1. State the regression equation that predicts the height of a tree based on the tree’s diameter at breast height of a person. Interpret the meaning of the slope in this equation. Predict the mean height for a tree that has a breast height diameter of 25 inches. Height Diameter at breast height Bark thickness 122.0 20 1.1 193.5 36 2.8 166.5 18 2.0 82.0 10 1.2 133.5 21 2.0 156.0 29 1.4…the soil biogeochemistry in Californian salt marshes wished to explore how two of the most common plant species, pickleweed and pacific cordgrass, affected the accumulation of nitrogen in the soil. They measured the concentration of ammonium, a molecular form of organic nitrogen, in the soil, and measured or manipulated the density of pickleweed and cordgrass. Manipulations of ½ meter square plots (20 plots per manipulation) included removing all cordgrass (cordgrass removal), removing all pickleweed (pickleweed removal), or mixed (the control - nothing removed, thus mixed plots included a mixture of natural pickleweed and cordgrass). Boxplots of ammonium concentrations in each of the three manipulation treatments. Letters indicate differences among means as determined by a Tukey posthoc test following ANOVA. (b) Overall relationship between cordgrass stem density and soil ammonium content (includes data from all plot treatments). The solid black line and the gray shading represent the…